

No two SQL Server environments are alike. A fix that resolves a performance issue in one environment may not work in another because every SQL Server instance has different workloads, hardware, data distribution, application behavior, and configuration. Even if you reproduce an issue in a test environment, there’s no guarantee the same solution will produce identical results in production.
So, probably instead of establishing a rigid step-by-step process, putting together a repeatable methodology can lead you to a resolution. This will eliminate blind guesses and at least bring you to an educated guess if the issue is too complicated.
A common workflow for troubleshooting performance issues on SQL Server may involve the following. But again, these are not necessarily phases or stages that you have to follow in a specific order. Real-world troubleshooting rarely happens in a perfect sequence. You may jump between these areas, revisit previous findings, or investigate multiple things simultaneously depending on the complexity of the issue.
- Define the scope
- Determine what changed
- Measure server health
- Identify bottlenecks
- Investigate the root cause
- Validate the fix / Monitor after implementation
- Document the incident
Scope it first
Every time I get a call about slow performance, the first thing I want to do is qualify the question itself. What does slow mean? Is it a widget that used to run for a few seconds and is now running for five minutes? By the way, this is one of the most common “slow” incidents I’ve seen in my last job at an ISV.
Scoping and discovery are probably the most critical parts of any troubleshooting task. This is the part where you can grasp the scope and nature of the issue at hand. Here, you will probably be able to establish your footing on how to approach the issue. Of course, a batch job running in SSIS or SQL Server Agent will require a different approach than, say, a process triggered by a user in the application’s frontend.
And, again, as I’ve said in my other post, I think it’s important to know when this issue started occurring. That alone might reveal a few important details about the very nature of the issue. Knowing whether you’re dealing with a single bad query or a server-wide issue will prevent you from investigating the wrong layer of the stack. For all you know, it’s not a performance issue at all, but a slowdown caused by the user’s ISP while working from home. I’ve seen this many times before.
My typical goal at the onset is to reproduce or replicate the issue in a test environment. That can give you the most bang for your buck because it allows you to investigate the issue and test potential solutions in a controlled environment.
The one thing we’re trying to prevent in the scoping is getting down the proverbial rabbit hole or chasing that red herring. Yes, I still love using those idioms in real life.
What changed?
Actually, this should be part of scoping, but I think it merits a whole section of its own. Knowing what changed could hold critical information as to the reason behind the issue. Maybe somebody just tweaked some lever on the application side, and that kind of caused a domino effect of some sort.
The main goal here is to find all the possible root causes and not point fingers at whoever might have been involved. There are a ton of reasons why a SQL Server might suddenly run slow. Configuration changes, new procedures, introduction of new indexes, unanticipated workload, network I/O, and even user workflows can cause slowdowns given the right circumstances where SQL Server can really slow down.
I’d start with the most recent change. And, of course, the typical answer to “What changed?” is almost always “nothing.” So, it’s up to you to determine how you surface what actually changed, if anything.
Know your baseline
If nothing has changed at all, then the next step is to determine any other activities that could be affecting the particular issue that you are investigating. It’s possible that the slowdown is caused by another task that is not necessarily related to the slowdown issue but is somehow affecting, for example, server resources.
I’ve seen cases where a third party started to send an amount of data that was not typical for an intra-day workload, which caused a domino effect on normal business operations. Not knowing what a “typical intra-day workload” looks like can complicate your investigation because you wouldn’t know if things are a factor in the issue or not.
For example, high CPU isn’t automatically a problem if the server normally runs at 90% CPU during month-end processing. While a query that normally consumes an infinitesimal amount of CPU and is suddenly taking 30% of the total CPU is almost certainly an issue. Always compare current metrics against a known baseline before concluding that something is abnormal.
Paul can tell you where it hurts
If you haven’t identified a possible root cause or figured out a narrative that may possibly connect the dots at this point, then it’s time to dig deeper. Paul Randal’s wait stats query can surface some clues about the ongoing issue. If you are troubleshooting a live issue, you probably want to combine that with Paul’s waiting task query. Glenn Berry’s Diagnostic queries are a must-have tool for any SQL Server DBA. If you are like me, when I encounter slow issues that are happening live, my instinct is to run Adam Machanic’s sp_whoisactive procedure. For many others running Brent O’s sp_BlitzFirst procedure is their go-to.
Wait stats and waiting tasks can be a superpower when it comes to troubleshooting a performance issue. Here is an example of how I used these two in the past to troubleshoot a live performance issue.
The wait type typically tells you where to go next. For example, blocking and lock waits send you to the head blocker (sp_WhoIsActive does a great job at identifying this). PAGEIOLATCH sends you toward storage I/O issues or queries performing large reads, possibly due to missing indexes. RESOURCE_SEMAPHORE points you toward memory grant pressure, while SOS_SCHEDULER_YIELD points toward CPU pressure. CXCONSUMER can be a benign wait type, but you should still investigate whether it is contributing to a bottleneck in a highly concurrent system.
Wait stats can help you identify the type of bottleneck SQL Server is experiencing, whether it’s related to I/O, CPU pressure, memory pressure, locking, or other resource contention.
Resource utilization
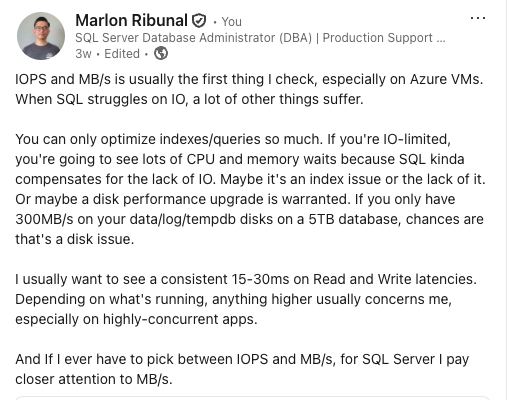
Ok, just like with wait stats, if you need to dig deeper, you should look into system resources as well. There is only so much you can achieve by optimizing indexes and queries. At some point, you need to ask whether the server has enough resources to handle the workload it is being asked to process. A perfectly tuned query can still struggle if the underlying infrastructure is already under pressure.
Here’s what I had to say about Disk IO on a LinkedIn post:
The key here is understanding whether you are dealing with a query problem, a workload problem, or a capacity problem. You can only go so far with index tuning and query optimization if the real issue is resource pressure underneath.
At some point, you have to understand what SQL Server is waiting on and whether the current infrastructure can support the workload. This is where troubleshooting becomes less about applying fixes and more about understanding the behavior of the system as a whole.
Bottleneck at the query level
We’re at the point where we are ruling out server-wide issues and closing in on specific queries that may be contributing to the problem. This is where tools like Query Store become extremely valuable because they allow you to look back at query behavior over time instead of relying only on what is happening at the exact moment of the incident.
One thing that I have been trying to learn lately is Query Store. At the time of writing, I am taking the SQLskills course on Query Store, IEQS. The more I learn about it, the more I realize how useful it can be when troubleshooting query performance issues, especially when dealing with plan regressions or queries that suddenly start behaving differently.
Of course, actual execution plans can give you a lot of information about where the bottleneck is occurring at the query level. Is it a cardinality estimation issue, memory grant pressure, spills, missing indexes, outdated statistics, or even parameter sniffing? The information you can glean from execution plans or Query Store can help you understand why a query is behaving the way it is and guide you toward the right tuning approach.
Is it blocking
If it’s a blocking chain, the first thing you want to do is find the head blocker and understand what it is doing before you start killing sessions. A blocked session is usually just a victim waiting for something else to finish. The real question is: what is holding the lock, and why is it taking so long?
This is where experience and judgment come into play. Just because you found a blocking session does not mean the immediate answer is to kill it. You need to understand what the session is doing, how long it has been running, and what impact terminating it will have. One interesting case I encountered in the past is a Service Broker queue that got stuck in limbo.
Communicate to stakeholders
During an incident, people understand that troubleshooting takes time. What they don’t want is uncertainty and silence while the issue is impacting the business. Keeping stakeholders informed shows that you are engaged, even when the root cause has not been identified yet.
In my experience, you don’t always have to provide a breakthrough every time you communicate. Sometimes a simple update like “we are seeing high I/O waits, we are checking storage latency, and we are looking at the queries involved” is enough to keep everyone aligned. The technical investigation may still be in progress, but at least everyone understands where things stand.
Validate the fix
Once the fix has been implemented, the work is not done yet. This is where you go back and validate if the change actually fixed the problem. Did the waits decrease? Did CPU return to its normal behavior? Did response times improve? Did the blocking clear? And probably the most important question: did the users notice the improvement?
One thing I always try to avoid is assuming that the issue is fixed just because the immediate symptom disappeared. A SQL Server environment is a complex system, and sometimes fixing one problem can expose another one. Keep monitoring after the change and make sure that things continue to behave as expected.
I’ve seen cases where a change looked successful during the initial troubleshooting session, only to find out later that the original problem came back or another issue surfaced. This is why validation and monitoring after the change are just as important as finding the fix in the first place.
Document the incident
Document what happened, what you checked, and what fixed the issue. Include the root cause, symptoms, timeline, diagnostics, fix, and any lessons learned. The next time a similar incident happens, this documentation can save you from starting the investigation from scratch.
Effective SQL Server troubleshooting is less about having the perfect fix ready and more about knowing how to narrow down the possibilities. You start with what you know, gather evidence, validate your assumptions, and slowly eliminate what doesn’t fit.
In my experience, the DBAs who troubleshoot well are not the ones who have memorized every possible solution. They are the ones who know how to ask the right questions, understand what the system is telling them, and make changes based on evidence. Having a repeatable methodology will take you much further than a collection of random tuning techniques.
Well, take it with a grain of salt. It depends. It always is.
The post How I Troubleshoot a Slow SQL Server Live first appeared on SQL, Code, Coffee, Etc..
