

A better fire alarm is still a fire. Many SQL Server incidents I get called about were preventable with controls already available in the client’s environment. Here is the audit I wish had been run before the pager rang, complete with the T-SQL.
I finished a root cause analysis recently that I was quietly proud of. It had everything a respectable incident document is supposed to have: a timeline to the second, the plan regression that started it, the parameter behind the regression, and the deployment three weeks earlier that changed the parameter.
The document was accurate. That was the uncomfortable part. Not one important fact required hindsight. Every warning had existed before the outage. I had not solved a mystery. I had written an excellent account of an avoidable event.
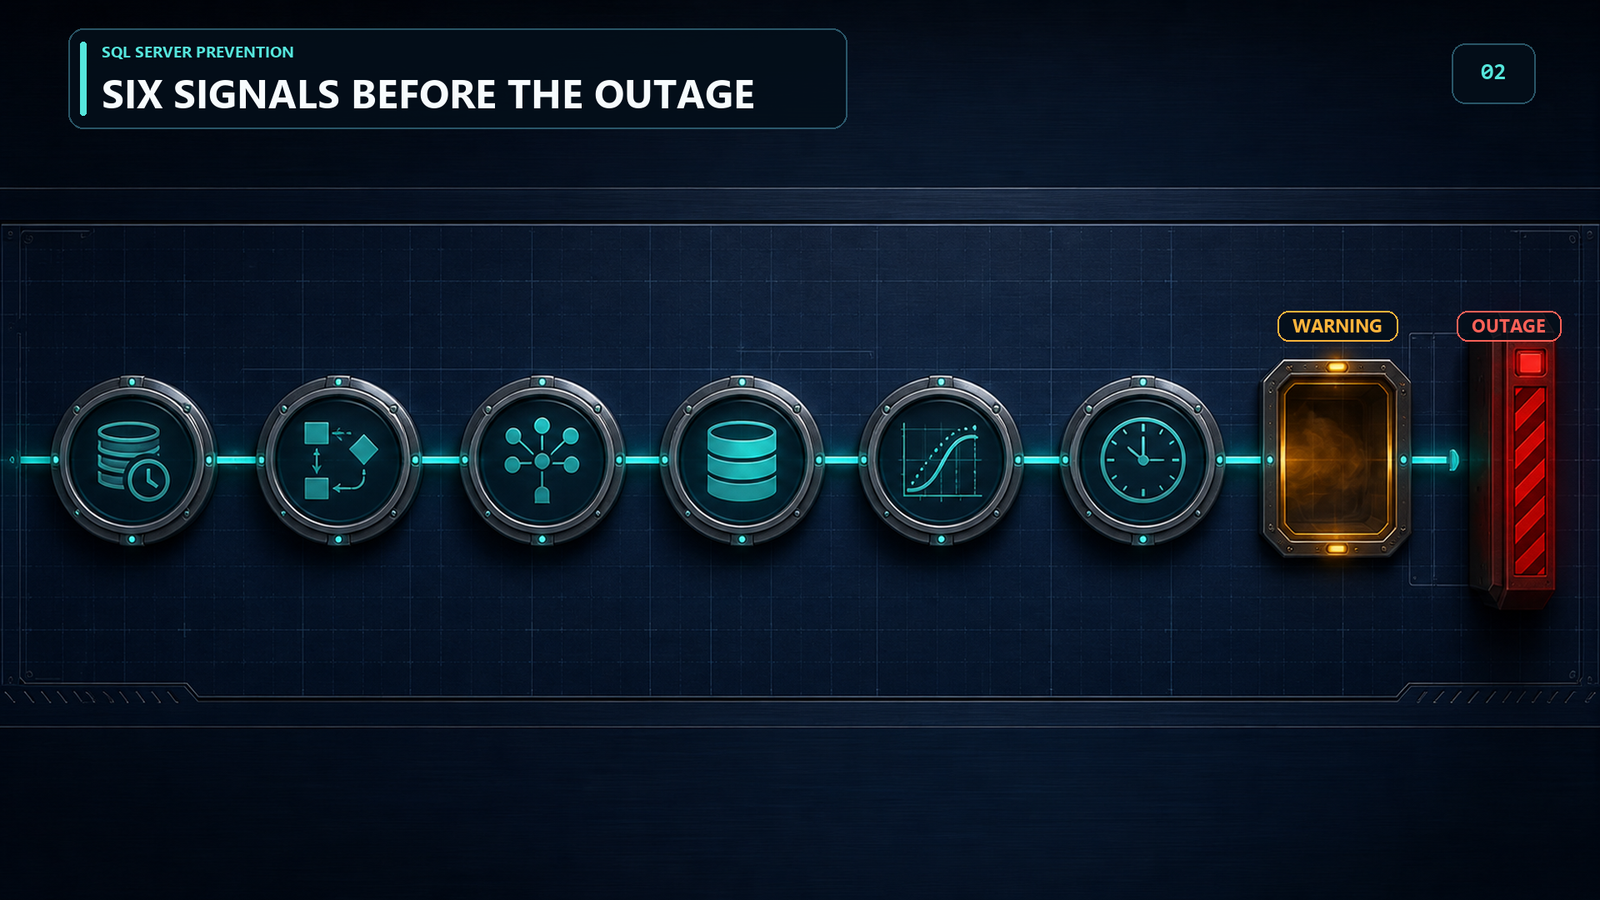
So this post is the other document, the one that should exist before the incident. These are eight checks I now run on every engagement, why each one matters, and the T-SQL to see where you stand. The first pass takes about an hour. Testing and implementing any change still belongs in normal change control.
A quick note. Details are blended across engagements and changed so nothing identifies a client. Test everything below outside production first, as you would with anything you read on the internet.
There is an easy way to ruin this audit before it begins: assume every edition can do every trick. Record the exact version and edition first. Automatic tuning remains an Enterprise feature in boxed SQL Server. Developer edition through SQL Server 2022, and Enterprise Developer in SQL Server 2025, provide the Enterprise feature set for non-production development. Resource Governor is available in Enterprise and Developer through SQL Server 2022. SQL Server 2025 makes it available in Enterprise, Enterprise Developer, Standard, and Standard Developer. Azure SQL offerings have different support rules.
SELECT SERVERPROPERTY('ProductVersion')      AS product_version,
       SERVERPROPERTY('ProductMajorVersion') AS major_version,
       SERVERPROPERTY('Edition')             AS edition,
       SERVERPROPERTY('EngineEdition')       AS engine_edition;
The audit queries are read-only, but read-only does not mean permission-free. Requirements vary by view and SQL Server version. Common permissions include VIEW DATABASE STATE or VIEW DATABASE PERFORMANCE STATE for database-scoped information, and VIEW SERVER STATE or VIEW SERVER PERFORMANCE STATE for instance-scoped information. Changing a setting requires separate permission and change approval.
Checks 1 and 2 are database-scoped. The detailed statistics and table-footprint queries in checks 5 and 6 are also database-scoped, so run them in each writable user database you intend to audit. The remaining queries examine instance-wide configuration, tempdb, Resource Governor, or all online user databases.
The One-Hour Prevention Pass
| Check | Failure class | First evidence to collect |
|---|---|---|
| 1 | Plan regression | Automatic tuning state and current recommendations |
| 2 | Missing performance history | Query Store state, capacity, and capture freshness |
| 3 | Parallel worker pressure | Cost threshold, MAXDOP, waits, and workload evidence |
| 4 | tempdb allocation contention |
File layout and sustained allocation-page waits |
| 5 | Cardinality estimate drift | Statistics settings, freshness, sampling, and plan estimates |
| 6 | Large-table deployment risk | Row count, space, lock impact, log impact, and rollback |
| 7 | Workload collision | Resource Governor policy and session classification |
| 8 | Slow-building outage conditions | Sustained blocking and transaction-log pressure |
Check 1: Automatic Plan Correction, With Receipts
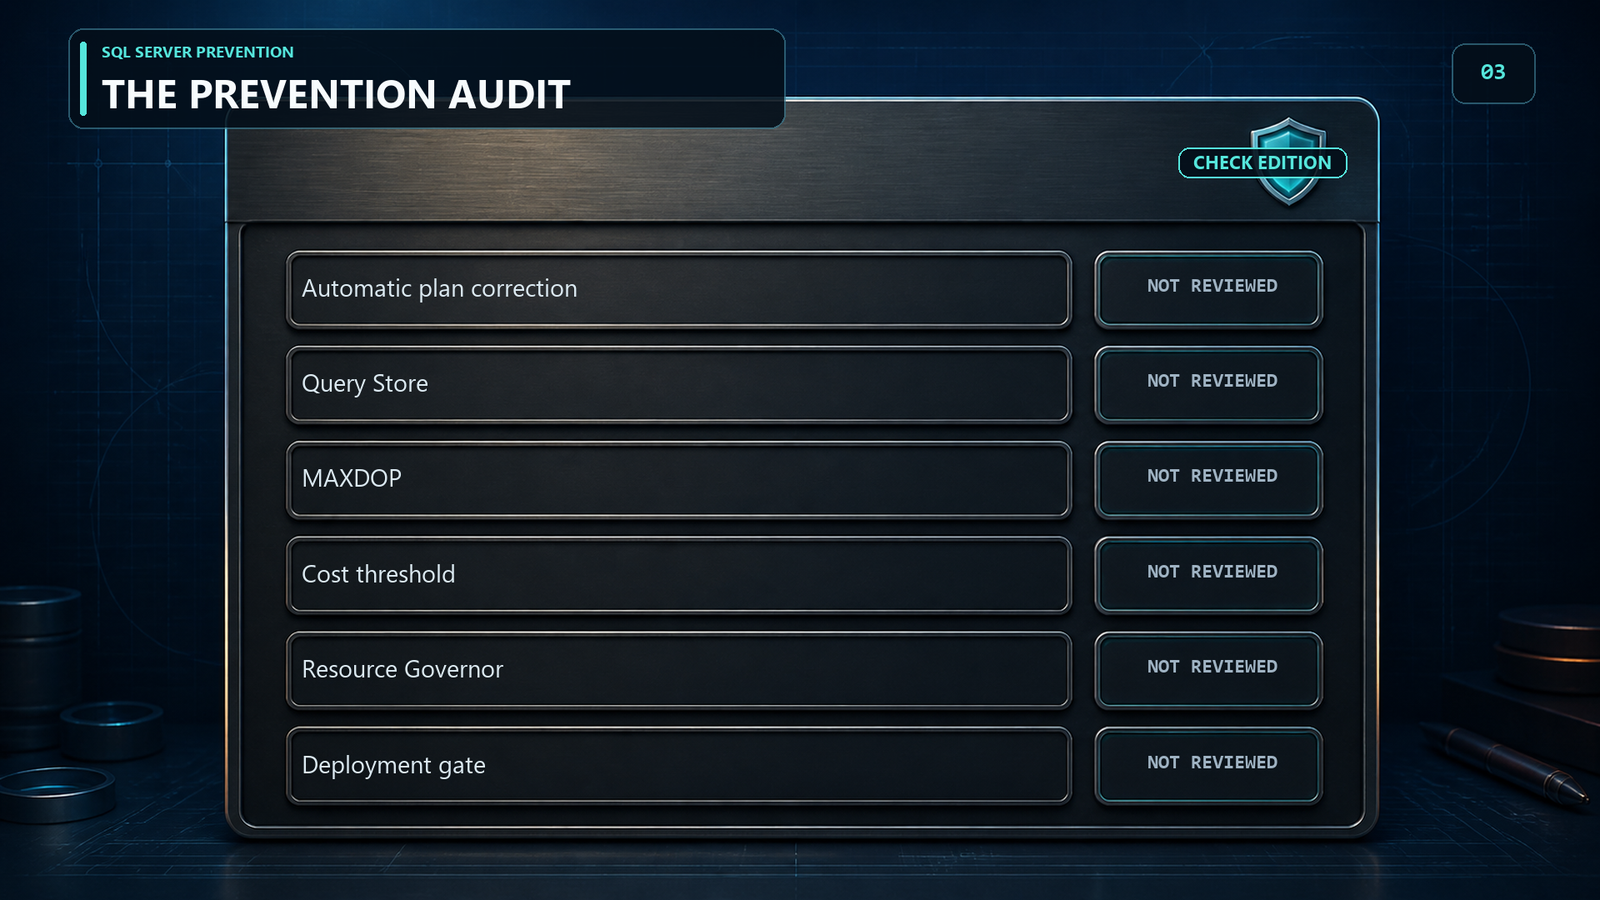
This is the one that annoys me most on supported editions. The capability has existed since SQL Server 2017, yet I still meet systems where nobody has even checked its state. Enabling it is one statement. Deciding to enable it is still a change, and those are not the same thing.
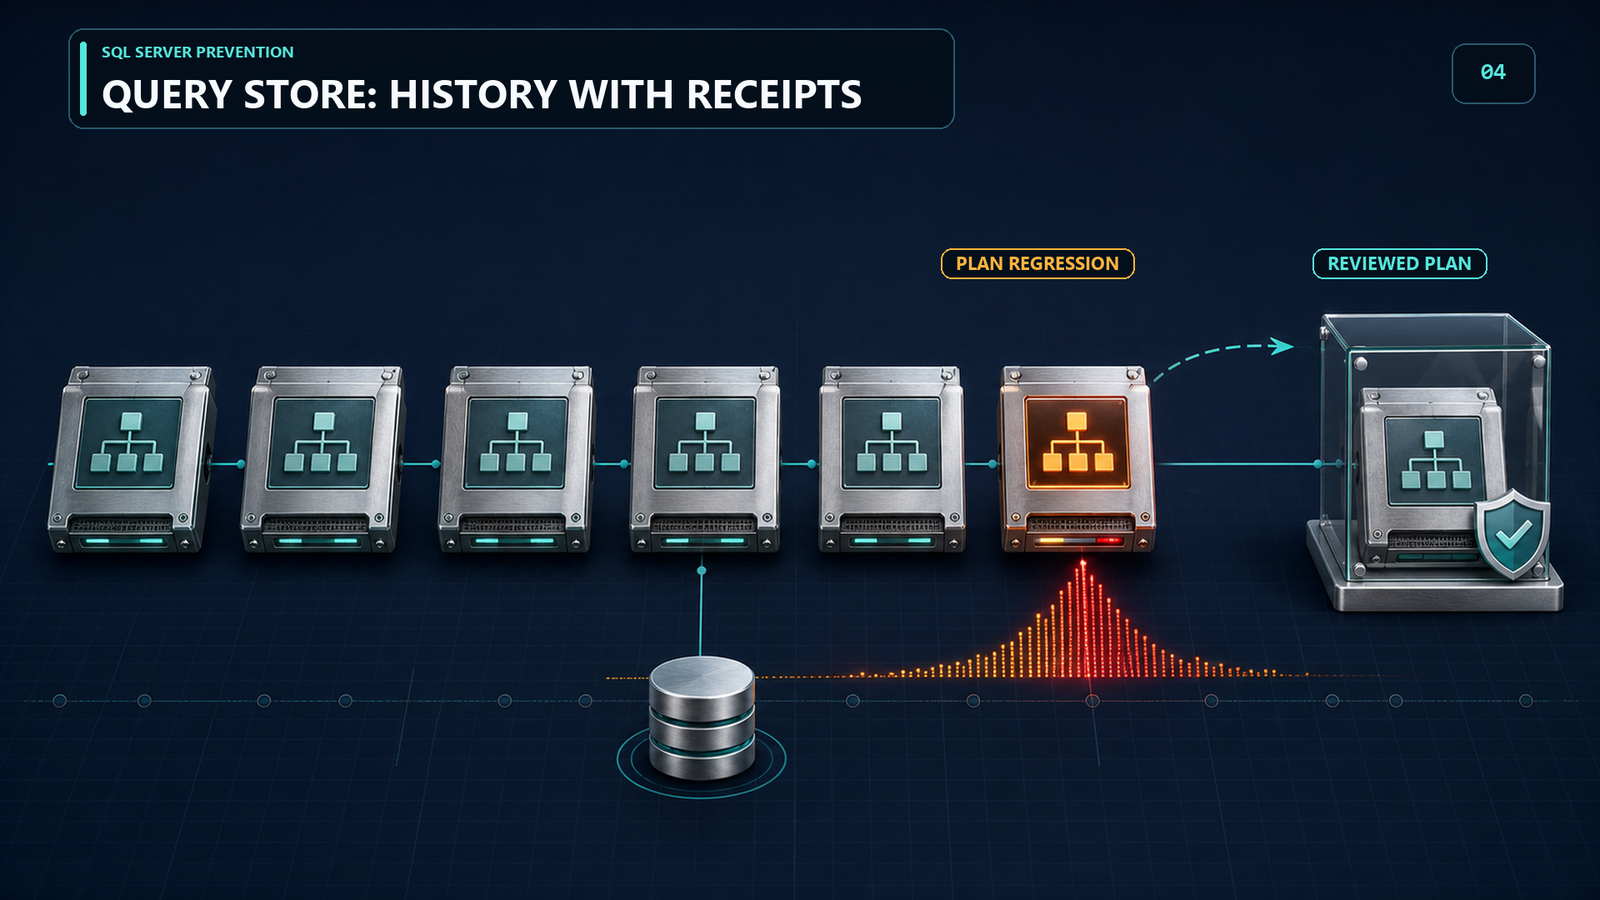
When SQL Server identifies an eligible query plan choice regression, automatic plan correction can force the last known good plan, verify the result, and undo the force if performance does not improve. It does not catch every regression, but it can make a useful class of plan incidents self-correcting.
SELECT name,
       desired_state_desc,
       actual_state_desc,
       reason_desc
FROM sys.database_automatic_tuning_options;
If actual_state_desc is OFF, do not jump straight to the ALTER statement. Read reason_desc, confirm that the version and edition support the feature, and verify that Query Store is healthy. A single command can enable the feature, but it cannot create the history the feature needs.
ALTER DATABASE CURRENT
SET AUTOMATIC_TUNING (FORCE_LAST_GOOD_PLAN = ON);
Automatic plan correction requires Query Store to be read-write, which is check 2. After a week, ask the database for receipts instead of assuming that ON means useful:
SELECT type,
       reason,
       score,
       execute_action_initiated_by,
       execute_action_initiated_time,
       revert_action_initiated_by,
       revert_action_initiated_time,
       JSON_VALUE(state, '$.currentValue')                        AS current_state,
       JSON_VALUE(state, '$.reason')                              AS state_reason,
       JSON_VALUE(details, '$.planForceDetails.queryId')          AS query_id,
       JSON_VALUE(details, '$.planForceDetails.regressedPlanId')  AS regressed_plan,
       JSON_VALUE(details, '$.planForceDetails.recommendedPlanId') AS recommended_plan,
       JSON_VALUE(details, '$.implementationDetails.script')      AS script
FROM sys.dm_db_tuning_recommendations
ORDER BY score DESC;
The score is the estimated value or effect of the recommendation on a scale from 0 to 100, with larger values considered better. If you are not ready to enable automatic correction, leave it off and review this DMV for a fortnight. SQL Server can still identify potential regressions when the option is disabled. Treat each recommendation as a lead to investigate, not a guaranteed future outage. The DMV is not persisted, so a Database Engine restart clears its recommendations. If the history matters, collect it elsewhere.
Check 2: Query Store Is On, but Is It Alive?
SQL Server 2022 enables Query Store by default for newly created databases. Databases restored from earlier versions, and databases carried through an in-place upgrade, retain their previous setting. In every case, on is not the same as working.
The failure I find most often is a Query Store sitting in READ_ONLY because its storage filled months ago. It stopped collecting quietly, nobody was alerted, and the first person to notice is the person who desperately needs yesterday’s history. That is a terrible time to discover that the security camera has not been recording.
SELECT actual_state_desc,
       desired_state_desc,
       readonly_reason,
       current_storage_size_mb,
       max_storage_size_mb,
       query_capture_mode_desc,
       size_based_cleanup_mode_desc,
       stale_query_threshold_days
 FROM sys.database_query_store_options;
On a database with an active workload, also confirm that Query Store contains recent runtime data:
SELECT MAX(last_execution_time) AS latest_captured_execution
FROM sys.query_store_runtime_stats;
A null or unexpectedly old timestamp on a busy database is a reason to inspect the capture policy and Query Store health. Interpret it against the workload and collection interval, because an idle database should not produce fresh executions.
If actual_state_desc and desired_state_desc disagree, something forced it read-only and readonly_reason tells you what. It is a bitmask. 65536 means the storage size was exceeded, which is the common one.
Here is a sensible starting configuration, not a universal recipe. Adjust the capacity and retention to the workload, then monitor them:
ALTER DATABASE CURRENT SET QUERY_STORE (
    OPERATION_MODE            = READ_WRITE,
    MAX_STORAGE_SIZE_MB       = 2048,
    QUERY_CAPTURE_MODE        = AUTO,
    SIZE_BASED_CLEANUP_MODE   = AUTO,
    CLEANUP_POLICY            = (STALE_QUERY_THRESHOLD_DAYS = 60),
    MAX_PLANS_PER_QUERY       = 200,
    INTERVAL_LENGTH_MINUTES   = 60,
    DATA_FLUSH_INTERVAL_SECONDS = 900
);
Two notes matter. QUERY_CAPTURE_MODE = ALL can fill storage with single-execution ad hoc noise on some workloads. Also, put an alert on the state. A red row in an occasional audit is not an alerting strategy:
IF DATABASEPROPERTYEX(DB_NAME(), 'Updateability') = 'READ_WRITE'
   AND EXISTS (SELECT 1 FROM sys.database_query_store_options
               WHERE actual_state_desc <> 'READ_WRITE')
    RAISERROR('Query Store is not recording', 16, 1);
Run that check as a SQL Server Agent job step and configure the job to notify somebody when the step fails. RAISERROR by itself does not send an email.
While you are here, audit what is already being forced, including plans with recorded forcing failures:
SELECT p.query_id,
       p.plan_id,
       p.is_forced_plan,
       p.plan_forcing_type_desc,
       p.force_failure_count,
       p.last_force_failure_reason_desc
FROM sys.query_store_plan AS p
WHERE p.is_forced_plan = 1
   OR p.force_failure_count > 0;
A nonzero force_failure_count means plan forcing has failed at least once. The counter increments when forcing fails during recompilation, not on every execution. Inspect last_force_failure_reason_desc, the current plan, and recent compilations before assuming that the query is still protected.
Check 3: Parallelism Without a Worker Stampede
SELECT name, value_in_use
FROM sys.configurations
WHERE name IN ('cost threshold for parallelism',
               'max degree of parallelism');
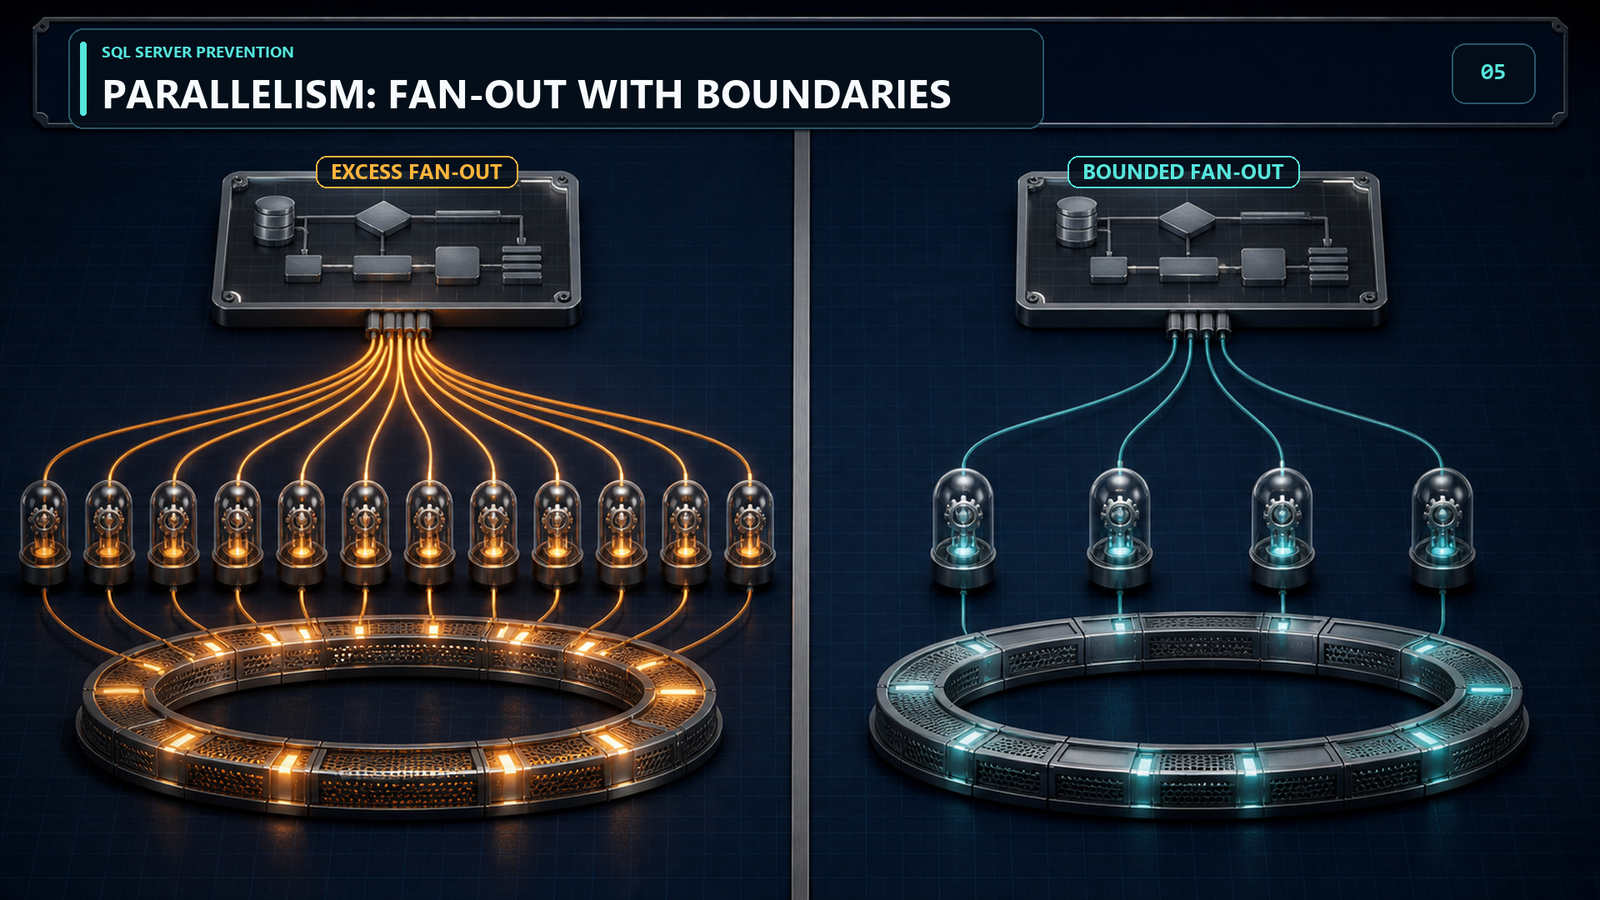
Cost threshold still defaults to 5. Five is a factory default, not a recommendation and certainly not a family tradition. SQL Server considers parallel alternatives when the best serial plan’s estimated cost exceeds the threshold. That cost is an optimizer estimate, not seconds. If the threshold is too low for an OLTP workload, too many modest queries can receive parallel plans and contribute to worker pressure. CXPACKET and CXCONSUMER waits are evidence to interpret, not a diagnosis by themselves.
DECLARE @target_cost_threshold int = 20; -- Example only. Choose from evidence.
DECLARE @apply_change bit = 0;           -- Change to 1 only after approval.

SELECT value_in_use AS current_value,
       @target_cost_threshold AS proposed_value,
       @apply_change AS apply_change
FROM sys.configurations
WHERE name="cost threshold for parallelism";

IF @apply_change = 0
    RETURN;

IF @target_cost_threshold NOT BETWEEN 0 AND 32767
    THROW 50000, 'Choose a cost threshold between 0 and 32767.', 1;

DECLARE @advanced_options_was_on bit =
(
    SELECT CONVERT(bit, value_in_use)
    FROM sys.configurations
    WHERE name="show advanced options"
);

IF @advanced_options_was_on = 0
BEGIN
    EXEC sys.sp_configure 'show advanced options', 1;
    RECONFIGURE;
END;

EXEC sys.sp_configure 'cost threshold for parallelism', @target_cost_threshold;
RECONFIGURE;

IF @advanced_options_was_on = 0
BEGIN
    EXEC sys.sp_configure 'show advanced options', 0;
    RECONFIGURE;
END;
The script is deliberately safe by default and uses 20 only as an example. Raise the threshold in small, reviewed increments, observe a complete business cycle, and compare Query Store evidence before and after. Set MAXDOP deliberately as well, based on SQL Server version, available logical processors, NUMA layout, and workload behavior instead of assuming that 0 is suitable.
Neither setting needs a restart, but both can change plan selection across the instance. Treat them as measured workload changes, not harmless checkboxes.
Check 4: tempdb, Measure the Latch Before Adding Files
SELECT file_id,
       name,
       type_desc,
       size / 128.0                 AS size_mb,
       CAST(CASE WHEN is_percent_growth = 1
                 THEN growth
                 ELSE growth * 8.0 / 1024
            END AS decimal(18,2))   AS growth_value,
       CASE WHEN is_percent_growth = 1
            THEN 'PERCENT' ELSE 'MB'
       END                          AS growth_unit
 FROM tempdb.sys.database_files;
tempdb has accumulated enough folklore to qualify for its own mythology. Start with evidence. Look for data files sized for the workload, equal sizes and growth increments across the data files, and fixed-megabyte growth rather than percentage growth. Multiple equally sized data files are a standard starting point for allocation contention, commonly one per logical processor up to eight, but do not multiply files when the waits do not support that diagnosis.
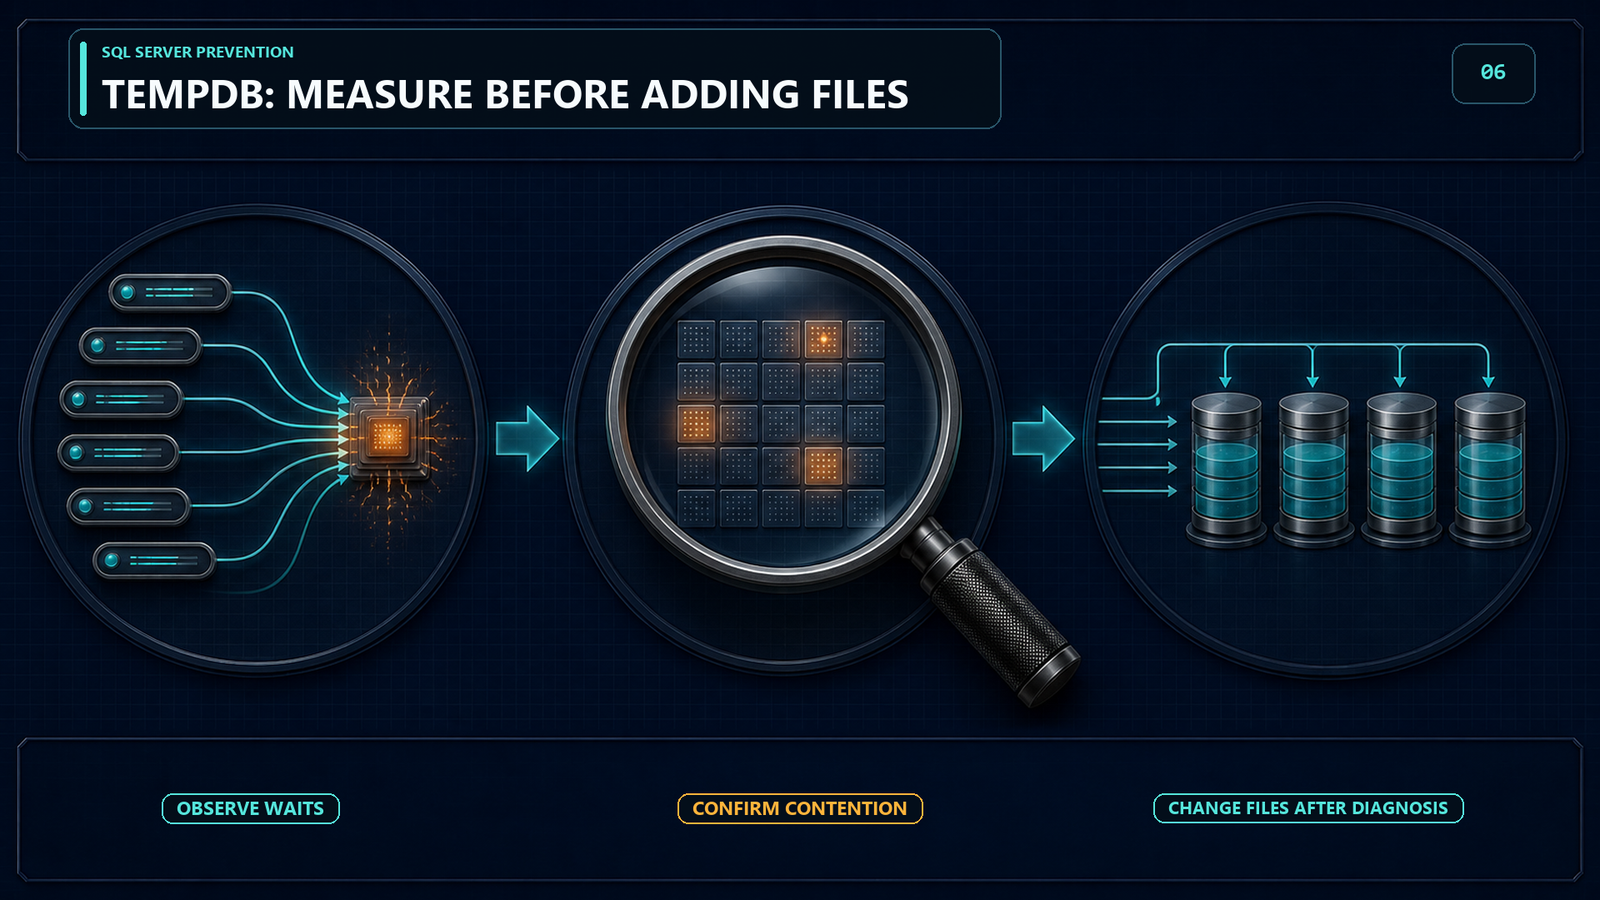
To confirm allocation contention instead of diagnosing by tradition, look at what is waiting right now:
SELECT session_id,
       wait_type,
       wait_duration_ms,
       blocking_session_id,
       resource_description
FROM sys.dm_os_waiting_tasks
WHERE wait_type LIKE 'PAGELATCH[_]%'
AND resource_description LIKE '2:%';2:1:1, 2:1:2, and 2:1:3 are familiar first-page examples for PFS, GAM, and SGAM in the first tempdb data file. Allocation pages repeat later in every file, so those three page numbers are examples, not a complete detector. This DMV is also a point-in-time view. Sample it repeatedly and look for sustained PAGELATCH waits on tempdb allocation pages before changing the file count. One screenshot is a clue. A repeated pattern is evidence.
Check 5: Statistics, Stale Is a Diagnosis
SELECT name,
       is_auto_create_stats_on,
       is_auto_update_stats_on,
       is_auto_update_stats_async_on
FROM sys.databases
WHERE database_id > 4;
Auto create and auto update should almost always be on. The interesting setting is is_auto_update_stats_async_on. With it off, a query that triggers an automatic statistics update waits for the update before compilation continues. Turning it on avoids that synchronous wait, but the triggering query compiles with the existing statistics while the refresh runs in the background. That is a tradeoff, not a universal recommendation. On SQL Server 2022 and later, also evaluate ASYNC_STATS_UPDATE_WAIT_AT_LOW_PRIORITY to reduce lock contention from the background update.
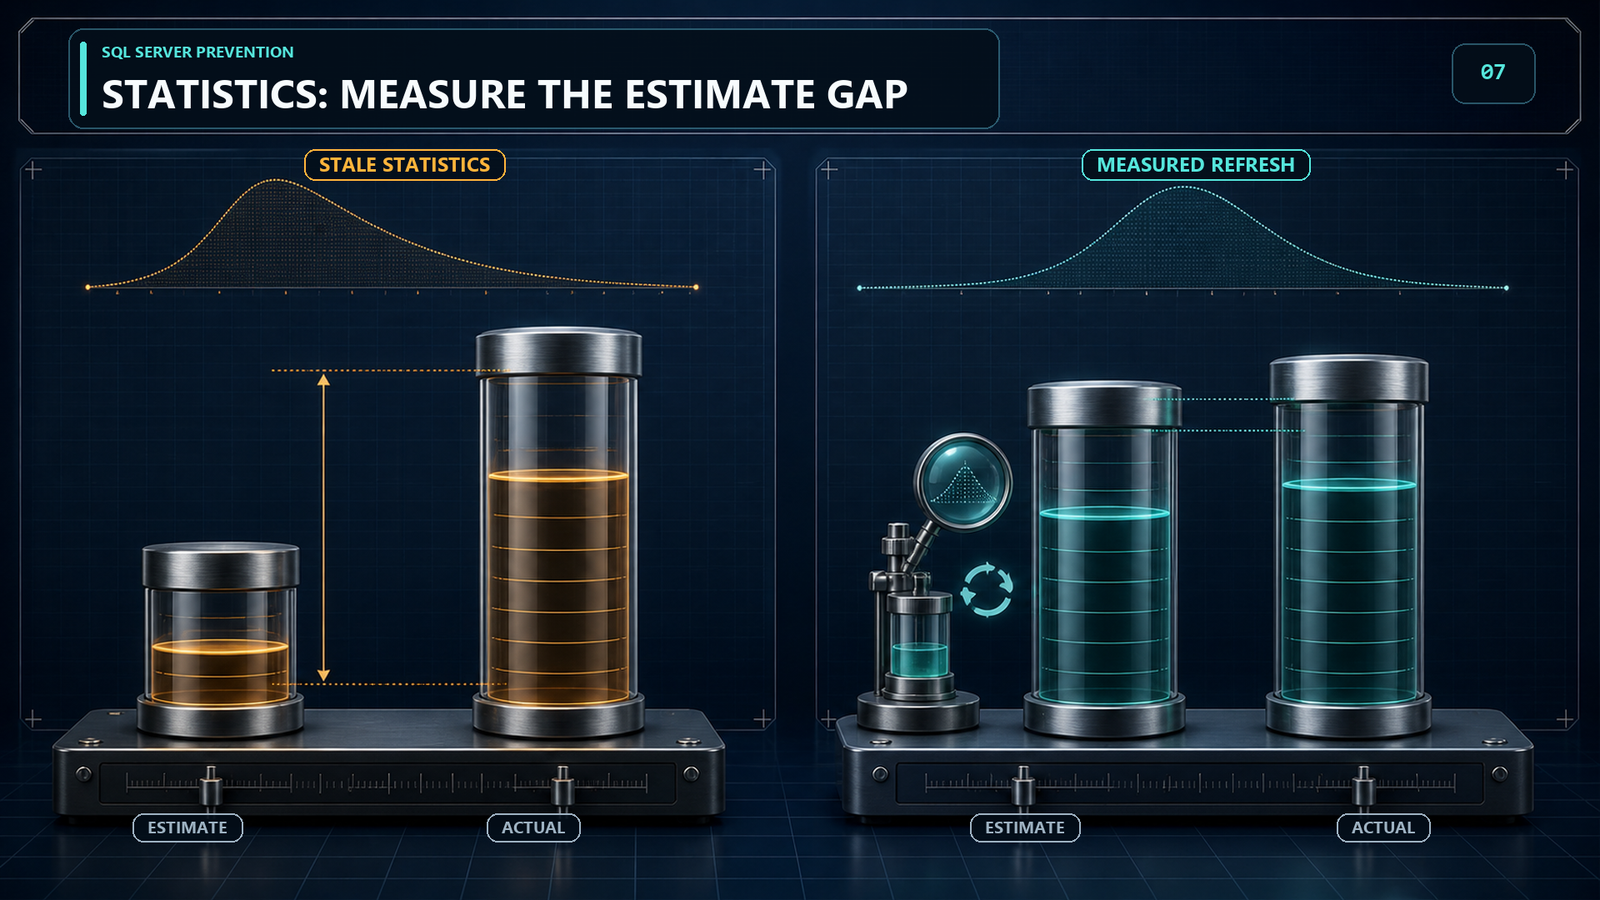
The settings query is instance-wide. The next query is database-scoped, so run it inside each database that matters. It finds heavily modified statistics on large rowsets that deserve inspection:
SELECT OBJECT_SCHEMA_NAME(s.object_id) AS schema_name,
       OBJECT_NAME(s.object_id)        AS table_name,
       s.name                          AS stats_name,
       sp.last_updated,
       sp.rows,
       sp.rows_sampled,
       sp.modification_counter
FROM sys.stats AS s
CROSS APPLY sys.dm_db_stats_properties(s.object_id, s.stats_id) AS sp
WHERE sp.rows > 1000000
  AND sp.modification_counter > sp.rows * 0.1
ORDER BY sp.modification_counter DESC;
The modification counter tracks changes to the leading statistics column. The 10 percent filter is a triage heuristic, not SQL Server’s internal automatic-update threshold. A large counter also does not prove that stale statistics caused the slow query. Compare rows_sampled with rows, then examine the affected query’s estimated and actual row counts. A targeted update with a higher sample rate can help when the statistics are genuinely responsible. Blanket full scans on every large table are how a maintenance job becomes the next incident report.
Check 6: Size Changes the Meaning of Safe
Most of the worst incidents I investigate trace back to a change that was technically correct and run at the wrong scale. The statement was valid. The table was enormous. SQL Server honored both facts.
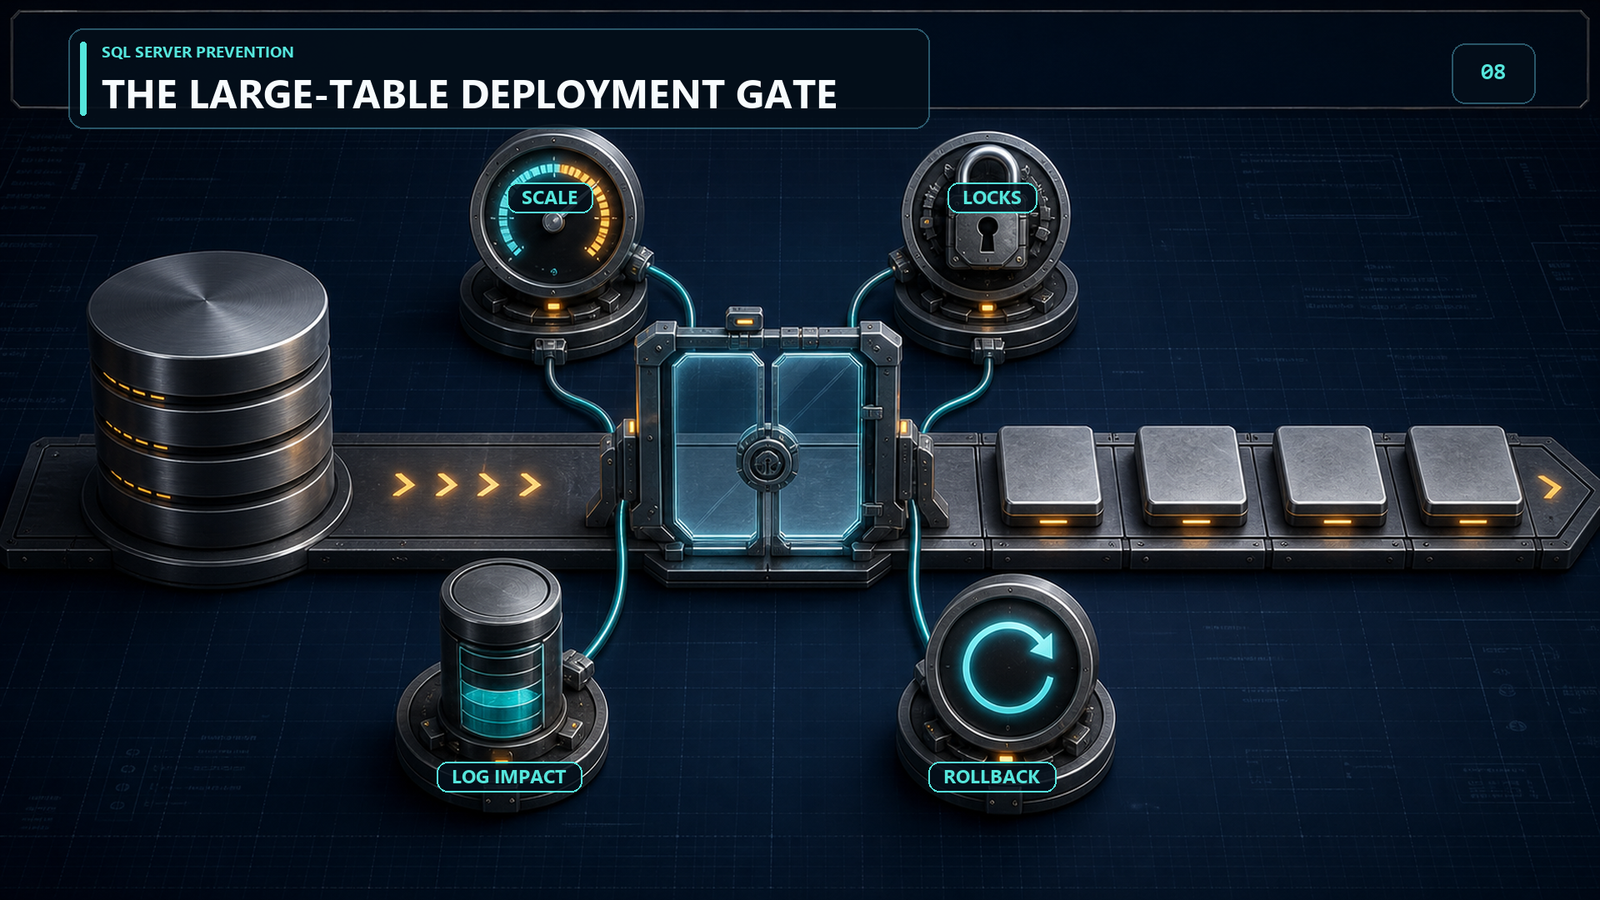
You do not need a new platform to begin. You need a list, published before the change window, of the tables where nothing casual happens:
WITH table_footprint AS
(
    SELECT object_id,
           SUM(CASE WHEN index_id IN (0, 1)
                    THEN row_count ELSE 0 END) AS row_count,
           SUM(reserved_page_count) * 8 / 1024.0 AS reserved_mb
    FROM sys.dm_db_partition_stats
    GROUP BY object_id
)
SELECT s.name AS schema_name,
       t.name AS table_name,
       f.row_count,
       f.reserved_mb
FROM table_footprint AS f
JOIN sys.tables AS t
  ON t.object_id = f.object_id
JOIN sys.schemas AS s
  ON s.schema_id = t.schema_id
WHERE f.row_count > 50000000
ORDER BY f.row_count DESC;
The row count is approximate, and reserved_mb includes the table’s indexes. Replace 50 million with a threshold that reflects your environment. That is enough to create a deployment gate. The rule fits in one sentence: no potentially blocking or size-dependent DDL against anything on this list without a written execution plan, a tested rollback path, and estimates for duration, transaction-log growth, and lock impact. That one rule has prevented more outages for my clients than many far more impressive-looking projects.
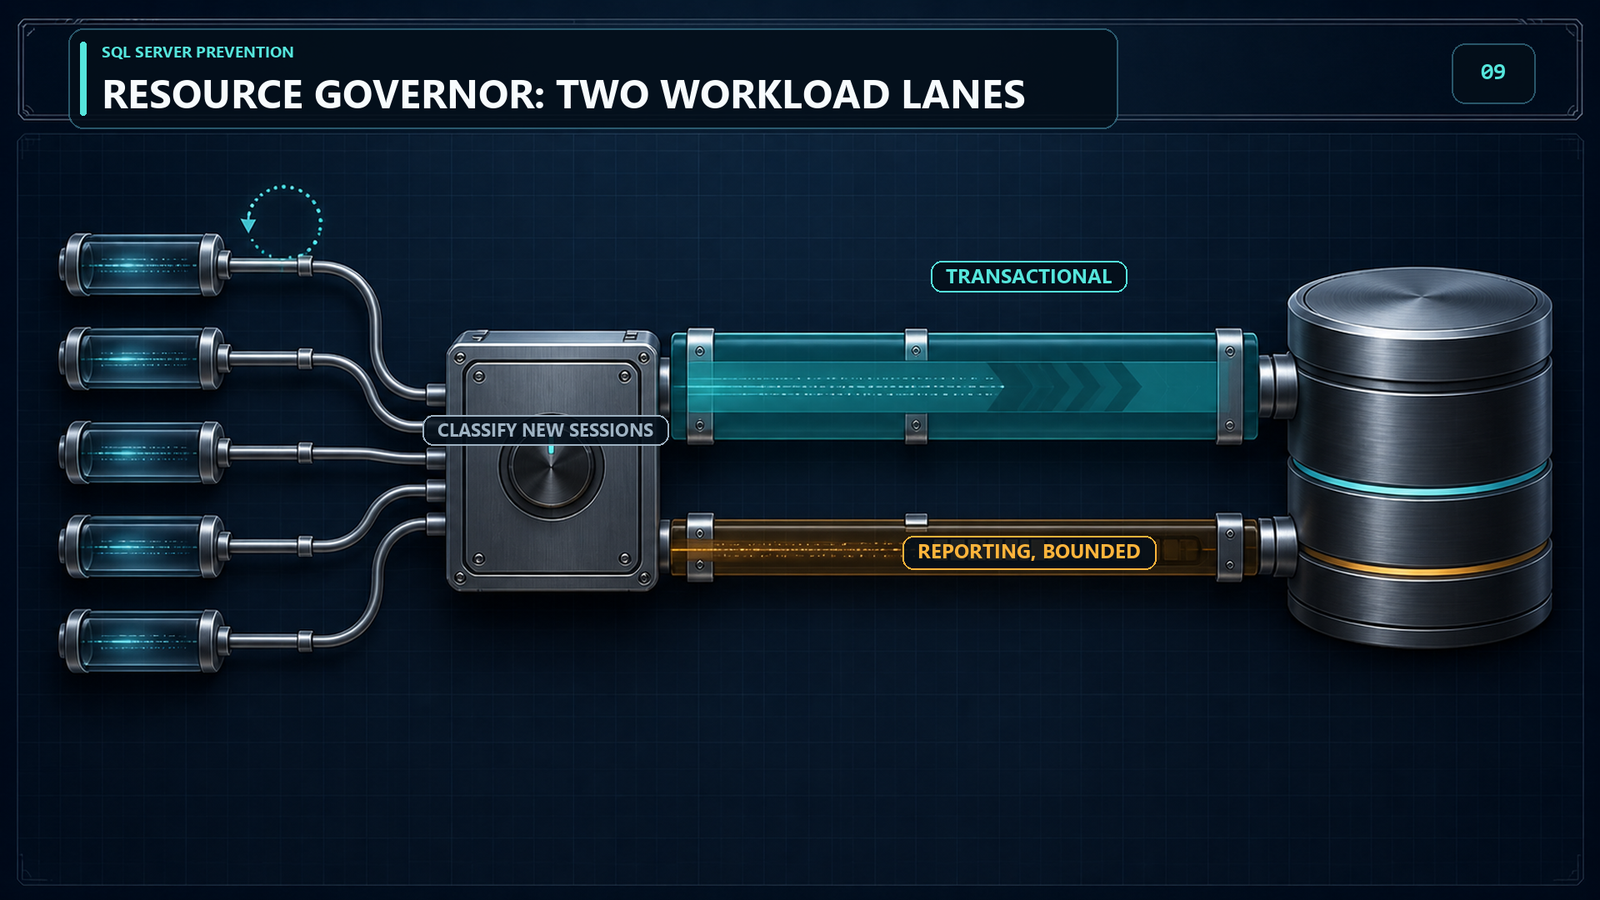
Check 7: Resource Governor for the Workload That Thinks It Owns the Server
Every shop has one. The month-end reporting workload arrives, flattens the transactional workload, gets investigated, gets explained, and then returns next month like a meeting nobody was brave enough to decline.
Governing that workload is supported where the edition permits. The values below are placeholders for a tested policy, not recommended production values. MAX_CPU_PERCENT is an opportunistic maximum that is enforced when CPU is contested, while CAP_CPU_PERCENT is a hard CPU ceiling. For ordinary disk-based workloads, MAX_MEMORY_PERCENT governs query workspace memory for the pool, not SQL Server’s total memory or buffer pool. Memory-optimized tables have additional pool behavior that must be evaluated separately.
USE master;
GO

CREATE RESOURCE POOL ReportingPool
WITH (MAX_CPU_PERCENT = 25,
      CAP_CPU_PERCENT = 40,
      MAX_MEMORY_PERCENT = 25);

CREATE WORKLOAD GROUP ReportingGroup
USING ReportingPool;
GO

CREATE FUNCTION dbo.fn_ClassifyWorkload()
RETURNS SYSNAME
WITH SCHEMABINDING
AS
BEGIN
    RETURN CASE
             WHEN SUSER_SNAME() = N'DOMAIN\ReportingService'
             THEN N'ReportingGroup'
             ELSE N'default'
           END;
END;
GO

ALTER RESOURCE GOVERNOR
WITH (CLASSIFIER_FUNCTION = dbo.fn_ClassifyWorkload);
ALTER RESOURCE GOVERNOR RECONFIGURE;
This is an illustrative new configuration. If the server already has a classifier function, add the routing rule to that function instead of replacing it with this example. The classifier belongs in master and is evaluated for every new session, even when connection pooling is enabled. Reusing an existing pooled session does not create a new classification event, and existing sessions keep their current group. Keep the function simple, test with a genuinely new connection, verify the assigned workload group, and confirm dedicated administrator connection access before rollout. An overly restrictive pool can make a query run longer and hold locks longer, so validate the effect on the protected transactional workload as carefully as the effect on reporting.
Check 8: Alert on the Smoke, Not the Ashes
Nearly everybody alerts on the outage. That is useful, but late. Far fewer teams alert on the condition that has been building for several minutes while the database is still answering calls and pretending everything is fine.
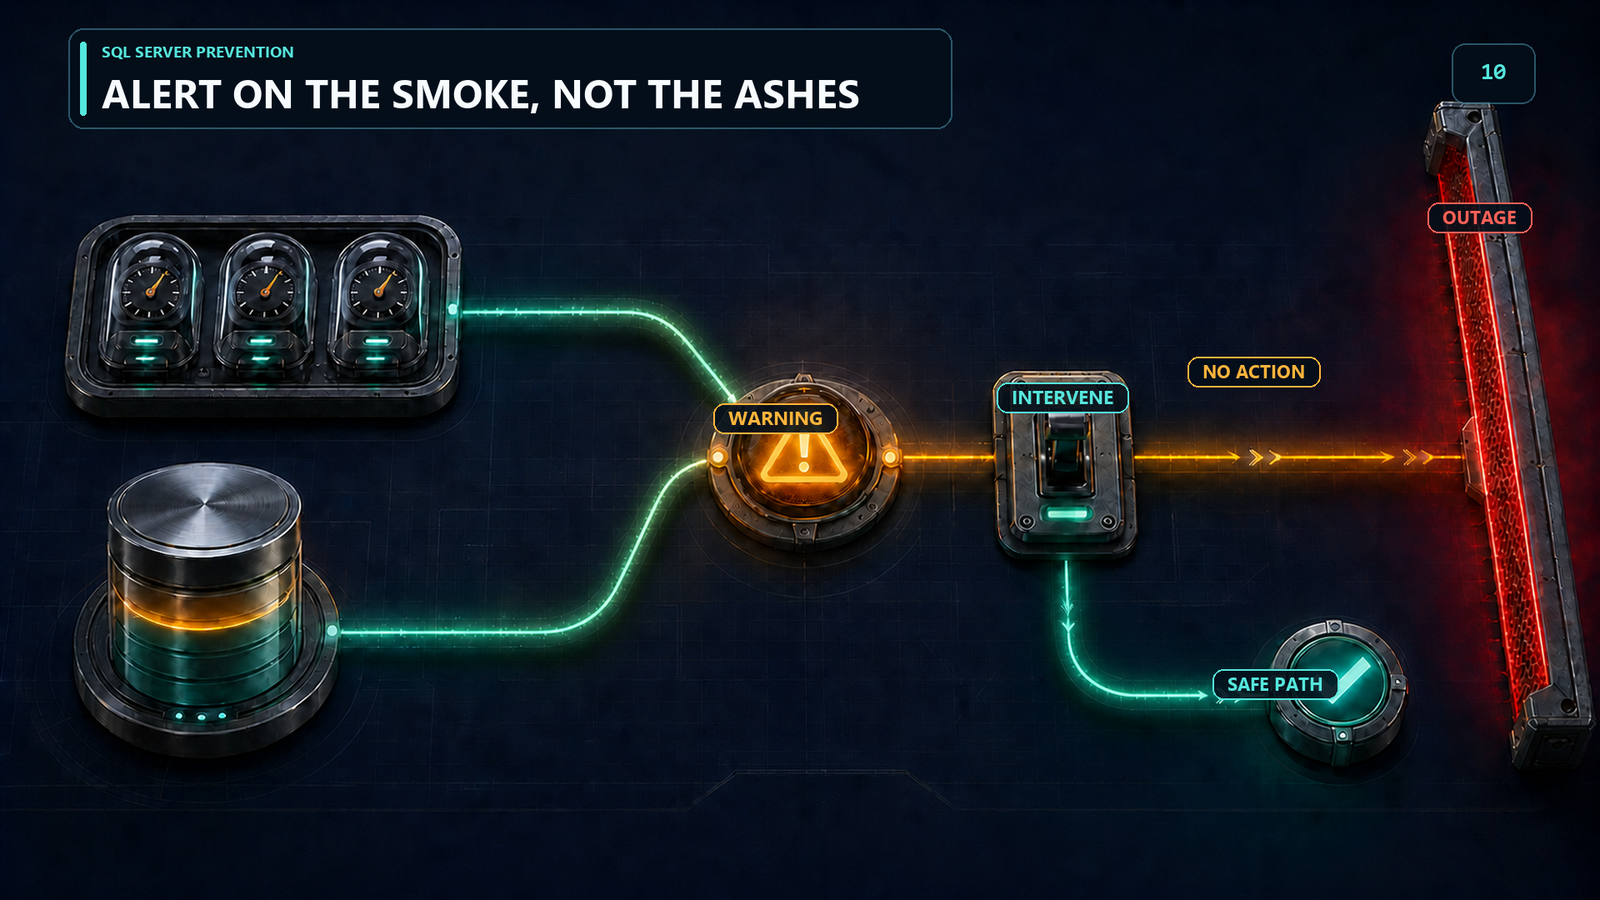
A current blocked request that has waited more than thirty seconds is one of the highest-value signals I know. Thirty seconds is an example threshold, not a law. Tune it to the workload, poll the query from a job, retain the results, and account for maintenance that is expected to block:
SELECT r.session_id,
       r.blocking_session_id,
       r.wait_time / 1000 AS wait_seconds,
       r.wait_type,
       r.wait_resource,
       DB_NAME(r.database_id) AS database_name,
       t.text                 AS running_sql
 FROM sys.dm_exec_requests AS r
OUTER APPLY sys.dm_exec_sql_text(r.sql_handle) AS t
WHERE r.blocking_session_id <> 0
  AND r.wait_time > 30000;
Positive blocking_session_id values identify another session. Negative values have special meanings, including orphaned distributed transactions and latch owners that SQL Server cannot identify. In particular, -5 by itself does not prove a performance problem. This query is an early-warning signal, not a complete blocking-chain analysis.
Add transaction-log utilization and the reason that log truncation is being held. This can expose pressure caused by an active transaction, missing log backups, replication, or an availability replica before the volume is full:
SELECT d.name AS database_name,
       ls.total_log_size_mb,
       ls.active_log_size_mb,
       CAST(100.0 * ls.active_log_size_mb /
            NULLIF(ls.total_log_size_mb, 0) AS decimal(6,2)) AS active_log_percent,
       ls.log_since_last_log_backup_mb,
       ls.log_truncation_holdup_reason
 FROM sys.databases AS d
CROSS APPLY sys.dm_db_log_stats(d.database_id) AS ls
WHERE d.state_desc="ONLINE"
  AND d.database_id > 4
 ORDER BY active_log_percent DESC;
sys.dm_db_log_stats is available in SQL Server 2016 SP2 and later. On an availability-group secondary, the function returns only a subset of its normal columns, so missing size values should not be interpreted as zero pressure. The query shows current pressure and the truncation holdup, not the history of file-growth events. Capture autogrowth separately with Extended Events or your monitoring platform. The warning signal is often visible before the pager goes off, but only if you retain a baseline and alert on sustained abnormal values.
Why None of This Gets Done
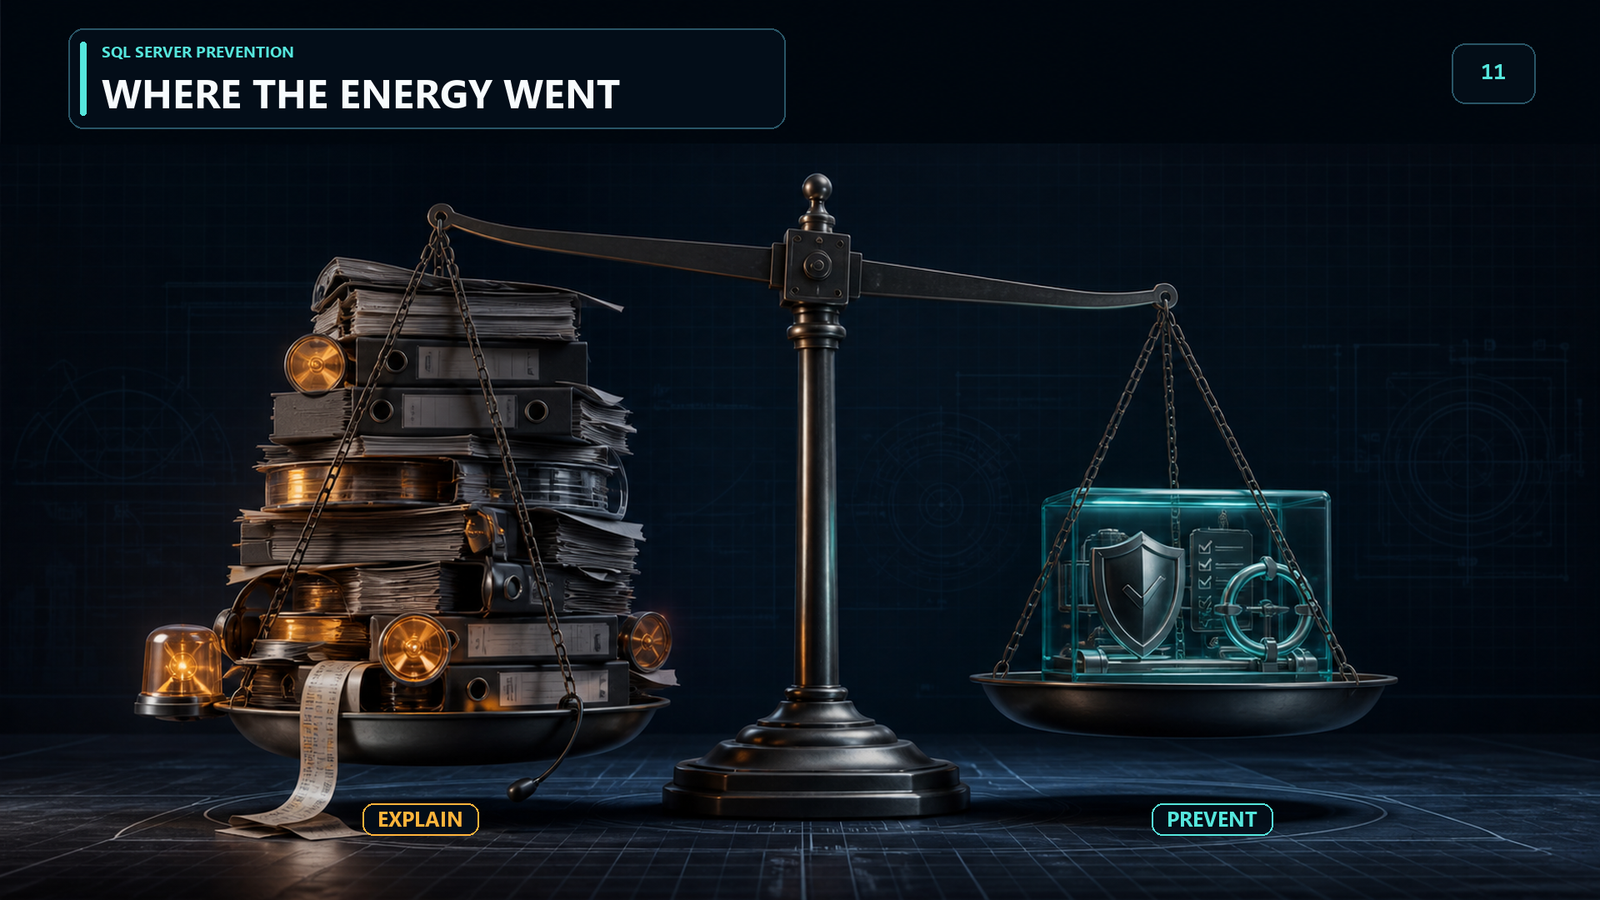
The first audit takes about an hour. Much of the remediation is configuration, code, and operating discipline using capabilities the organization already owns. Edition-specific features still need to be checked before anybody promises a change. So why is so much of the practical prevention layer unused?
Because prevention is invisible, and invisible work has no advocate.
The person who spends a quiet Thursday evaluating automatic plan correction, fixing a proven tempdb problem, testing the parallelism configuration, and writing a blocking alert has produced, from the outside, nothing at all. No incident report. No bridge call where they were heroic. Nothing dramatic to put in a review.
The person who fixes a catastrophic outage at four in the morning gets thanked in a company-wide email. The person whose preparation prevented the outage gets a quiet night and no email. I know which reward I prefer, but I also know which one organizations tend to notice.
Nobody here is behaving irrationally. The incentives point at the fire rather than at the wiring, and they have for a long time.
My practical advice is to describe prevention in the language of the incident it removes. Not “I enabled automatic tuning.” Instead, “eligible plan regressions can now be corrected automatically and verified after the force.” Not “I added an alert.” Instead, “we now detect sustained blocking while there is still time to act.” Same technical work, much clearer business value.
Where This Argument Has Limits
Two honest caveats belong here, and the second is the stronger one.
Prevention has a ceiling. You can remove known failure classes. You cannot remove the unprecedented. Monitoring and explanation will never be worth zero, and anyone promising a world with no incidents is selling you something.
You cannot prevent a failure class you have never understood. The root cause analysis is the input to the prevention work. My complaint was never that we write them. It is that we write them, file them, and do not do the next thing.
So the claim is narrower than the title suggests. Explanation is necessary. Treating explanation as the destination is the mistake.
The Section I Now Add to Every Analysis
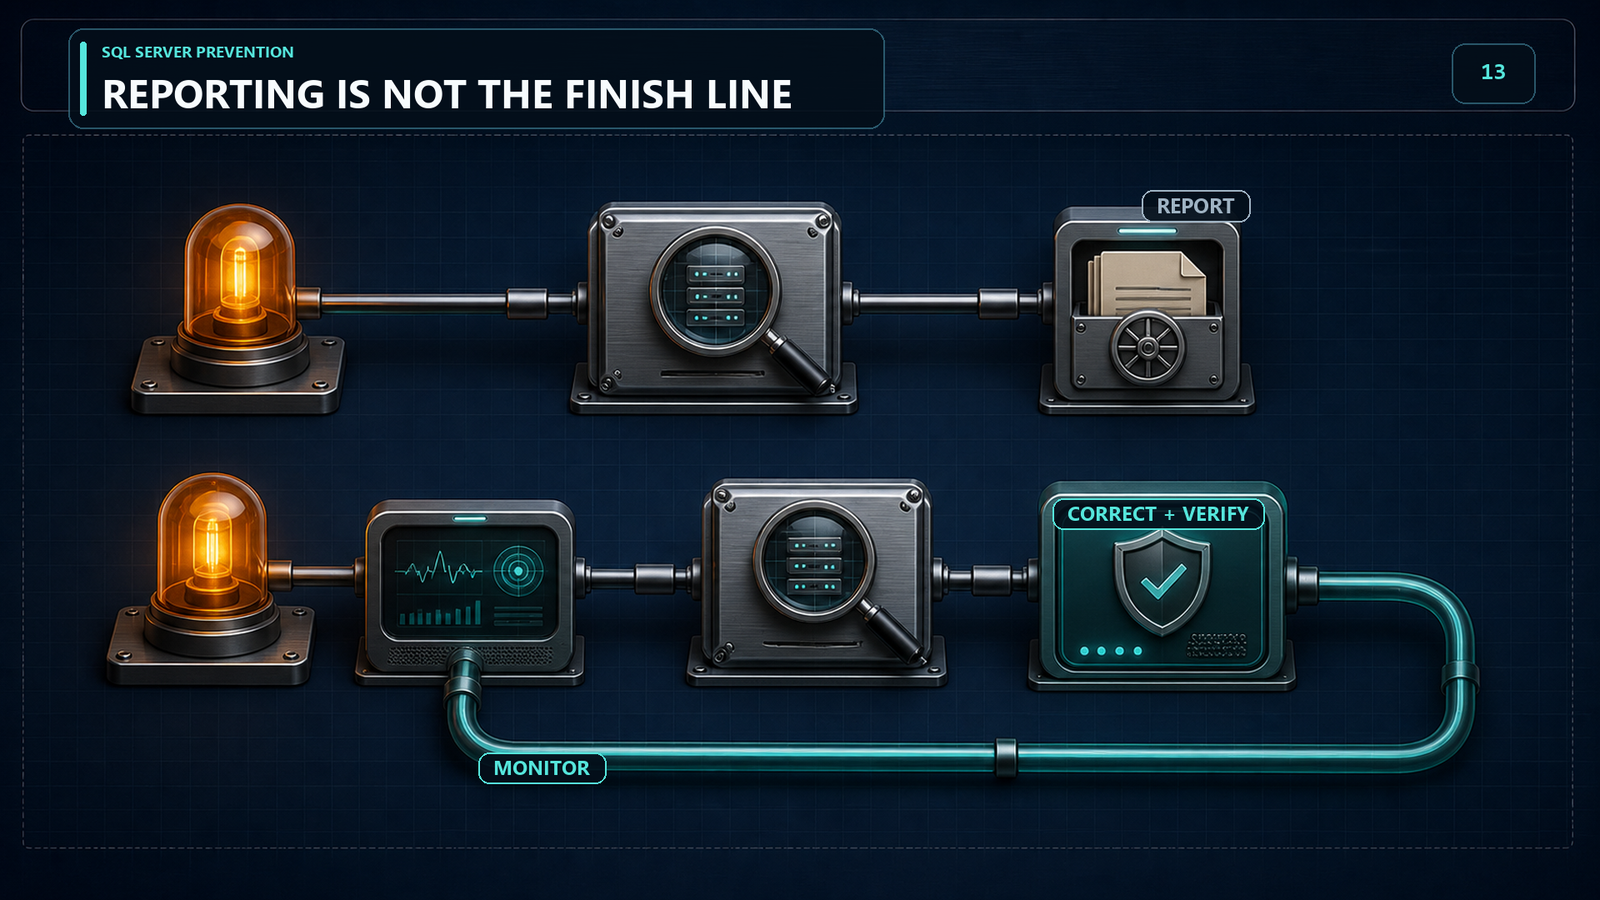
At the end of every incident document I write, there is now a section that is not about the incident. It is about making the same failure class less welcome next time.
It names the failure class, states what would have made it impossible rather than merely visible, and gives a rough cost. Sometimes the cost is an afternoon and a checkbox. Sometimes it is a planned project. Both are easier to fund when the cost and the failure being removed are explicit.
Some clients skip that section. A few do not, and those are the clients I eventually stop hearing from. It is the strangest form of professional success I have encountered, and I have decided to enjoy it.
The thread underneath all of this is who holds the judgment when the tooling sounds confident, which is the argument across all thirty essays in my book AI: Nobody’s in There: But we’re still in here. All thirty are free to read at pinaldave.com. If you would rather hold a copy, it is on Amazon in paperback, Kindle and audiobook.
If you take one thing from this, take the smallest one. Record the version and edition, then run the Query Store state query from check 2 against your busiest database. It takes about two minutes. If the answer is READ_ONLY, the most valuable performance history on the server may already be disappearing quietly.
This is not a story about explaining incidents better, it is a story about making the explanation a rarer thing to need.
Reference: Pinal Dave (https://blog.sqlauthority.com/), SQL Server Prevention, X
