

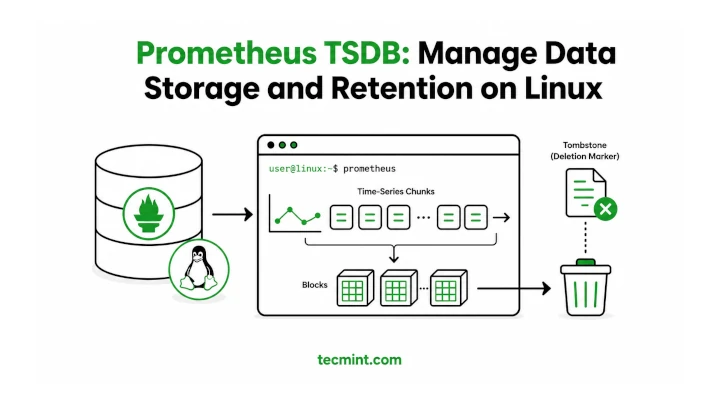
Prometheus stores every metric it collects in its own time-series database (TSDB). Over time, this database grows, and if your disk fills up or the server goes down, you’ll need to know how to manage and recover it.
You might install Prometheus, configure a few targets, and let it run for months without any issues. Then one day, /var/lib/prometheus becomes full, Prometheus refuses to start, and you find a directory full of numbered folders without knowing what they are or whether it’s safe to remove them.
In this chapter, you’ll learn where Prometheus stores its data, how to configure data retention, how TSDB compaction works, and how to create and restore database snapshots on Linux using Prometheus.
The examples are tested on Ubuntu 26.04 and RHEL 9, but they work the same on any recent Linux distribution running Prometheus 2.x or 3.x.
How Prometheus Stores Data on Disk
Prometheus stores all the metrics it collects in a local Time Series Database (TSDB). This database is designed specifically for storing time-stamped metric data efficiently.
Instead of saving each metric directly to disk, Prometheus first keeps new data in memory and the write-ahead log (WAL). About every two hours, it writes that data into a permanent, read-only block on disk.
If you look inside the Prometheus data directory, you’ll see something like this:
ls -la /var/lib/prometheus/data
Example Output:
drwxr-xr-x 4 prometheus prometheus 4096 Jul 20 09:00 01J9ZK3XW9K7...
drwxr-xr-x 4 prometheus prometheus 4096 Jul 20 11:00 01J9ZK5R2M4T...
drwxr-xr-x 3 prometheus prometheus 4096 Jul 21 08:12 wal
lrwxrwxrwx 1 prometheus prometheus   34 Jul 21 08:12 chunks_head -> 01J9ZKAB77Q2.../chunks
Each folder with a long name is called a block. A block contains the metric data collected during a specific time period. Inside each block, you’ll find:
chunks/– Stores the compressed metric samples.index– Maps metric names and labels to the data stored in the chunks.meta.json– Contains information about the block, such as its time range and other metadata.
The wal directory stands for Write-Ahead Log. It temporarily stores newly collected metrics before they are written into a block. This helps prevent data loss if Prometheus stops unexpectedly.
The chunks_head link points to the active in-memory data that hasn’t been written into a block yet.
If you notice the wal directory growing much larger than usual, it often means Prometheus is unable to create new blocks fast enough. This can happen if compaction is delayed, disk I/O is slow, or Prometheus is overloaded.
Checking Block Health with promtool
Before changing retention settings or creating backups, it’s a good idea to check the health of your TSDB. Prometheus includes a command-line tool called promtool, which provides several commands for inspecting and troubleshooting the database.
To analyze your TSDB, run:
promtool tsdb analyze /var/lib/prometheus
Example output:
Block ID: 01J9ZK5R2M4TQXK9J8N3PZC7VW
Duration: 2h0m0s
Series: 48213
Label names: 62
Postings (unique label pairs): 1847
The Series value shows how many unique time series are stored in the analyzed block. If this number keeps increasing even though the number of monitored targets hasn’t changed, you may have a high-cardinality problem.
This usually happens when a label contains constantly changing values, such as request IDs, session IDs, timestamps, or client IP addresses, causing Prometheus to create a new time series for each unique value.
Some other useful promtool TSDB commands include:
1. Analyze the TSDB
promtool tsdb analyze /var/lib/prometheus
Displays information such as series count, label cardinality, and data churn to help identify storage or performance issues.
2. List all blocks
promtool tsdb list /var/lib/prometheus
Shows every block along with its minimum and maximum timestamps. This is useful for checking whether any time ranges are missing.
3. Create blocks from existing data
promtool tsdb list /var/lib/prometheus
Rebuilds TSDB blocks from OpenMetrics data or recording rule files. This command is mainly used when importing or backfilling historical metrics.
Setting Retention by Time and Size
Prometheus automatically removes old data, but the default retention settings may not match the amount of disk space you have. You can control how long data is kept or how much disk space the TSDB is allowed to use by setting retention options when starting Prometheus.
If you’re running Prometheus as a systemd service, create or edit an override file:
sudo systemctl edit prometheus
You’ll need sudo because the systemd service configuration is managed by the root user.
Add or update the following lines:
[Service]
ExecStart=
ExecStart=/usr/local/bin/prometheus \
  --config.file=/etc/prometheus/prometheus.yml \
  --storage.tsdb.path=/var/lib/prometheus \
  --storage.tsdb.retention.time=15d \
  --storage.tsdb.retention.size=10GB
Here:
--storage.tsdb.retention.time=15dkeeps data for up to 15 days.--storage.tsdb.retention.size=10GBlimits the TSDB to 10 GB of disk space.
If both options are set, Prometheus applies whichever limit is reached first. For example, if the database reaches 10 GB before the data is 15 days old, the oldest blocks are removed to free up space.
When setting a size limit, leave some free disk space instead of using the entire partition. During compaction, Prometheus temporarily writes new blocks before removing old ones, so it needs extra space to complete the process successfully.
After saving the changes, reload and restart the service:
sudo systemctl daemon-reload
sudo systemctl restart prometheus
To verify that Prometheus started correctly, view the logs:
sudo journalctl -u prometheus -f
If everything starts normally, you’ll see messages indicating that the WAL was loaded and the TSDB started successfully.
If you get a Permission denied error for the data directory, make sure the Prometheus service user owns it:
sudo chown -R prometheus:prometheus /var/lib/prometheus
Then restart the service again.
How Compaction Reclaims Disk Space
Prometheus doesn’t immediately free up disk space when old data expires. Instead, it uses a process called compaction, which merges smaller blocks into larger ones and removes data that has passed the configured retention limits.
New data is first stored in two-hour blocks. As these blocks get older, Prometheus combines them into larger blocks covering longer time ranges. During this process, expired data is permanently removed.
This means deleting a scrape target or removing a metric from your configuration doesn’t instantly reduce disk usage. The old data remains in existing blocks until those blocks are compacted. Depending on your retention settings and how much data you store, it may take several compaction cycles before the space is reclaimed.
You can check when compaction occurs by looking at the Prometheus logs:
sudo journalctl -u prometheus | grep compact
Example output:
level=info msg="compact blocks" count=3 mint=1721520000000 maxt=1721527200000 duration=4.2s
In this example:
count=3means Prometheus merged three existing blocks into a single block.duration=4.2sshows the compaction took 4.2 seconds to complete.mintandmaxtrepresent the minimum and maximum timestamps covered by the new block.
Occasional compaction is normal. However, if you notice compaction taking longer over time, it may indicate that your Prometheus server is storing more time series than before or that disk performance is becoming a bottleneck.
In that case, consider increasing your storage capacity, reducing metric cardinality, or lowering your retention settings.
Taking a Snapshot Before Making Changes
Before changing retention settings or performing maintenance, it’s a good idea to create a backup of your TSDB. Prometheus doesn’t provide a database dump like MySQL, but it does support live snapshots through its Admin API. A snapshot creates a consistent copy of the database without stopping Prometheus.
The Admin API is disabled by default, so you’ll need to enable it first. Edit the Prometheus systemd override:
sudo systemctl edit prometheus
Add the following option to the ExecStart line:
--web.enable-admin-api
Save the file, then reload and restart Prometheus:
sudo systemctl daemon-reload
sudo systemctl restart prometheus
Now create a snapshot:
curl -X POST http://localhost:9090/api/v1/admin/tsdb/snapshot
Example output:
{
  "status": "success",
  "data": {
    "name": "20260721T081204Z-8f2a91c3d4e5"
  }
}
Prometheus creates the snapshot under:
/var/lib/prometheus/snapshots/
Replace
sudo tar -czf prometheus-backup-$(date +%F).tar.gz \
  -C /var/lib/prometheus/snapshots \
Here’s what the command does:
tar -czfcreates a compressed.tar.gzarchive.-C /var/lib/prometheus/snapshotschanges to the snapshots directory before creating the archive.
Copy the resulting archive to another server or external storage so you have a backup if the local disk fails.
If this helped you avoid a disk-full headache, share it with a teammate who still backs up Prometheus by manually copying block folders.
Restoring a Snapshot
To restore a backup, stop Prometheus first so it doesn’t try to access the TSDB while you’re replacing it.
sudo systemctl stop prometheus
If you’re restoring over an existing installation, move or remove the current data directory first so it doesn’t conflict with the restored data.
Extract the backup into the Prometheus data directory:
sudo tar -xzf prometheus-backup-2026-07-21.tar.gz \ -C /var/lib/prometheus
Then start Prometheus again:
sudo systemctl start prometheus
When Prometheus starts, it scans the data directory, loads the restored TSDB blocks, and continues using them as if they had been created locally. If you enabled the Admin API only for creating snapshots, it’s a good idea to disable it afterward.
Remove the --web.enable-admin-api option from the systemd override file and restart the service. Leaving it disabled reduces the number of administrative endpoints exposed by Prometheus.
On RHEL and Rocky Linux
The Prometheus configuration and snapshot commands are the same on RHEL and Rocky Linux. The main difference is SELinux, which may prevent Prometheus from accessing a data directory if it doesn’t have the correct security context.
If you’ve moved the TSDB to a new location, assign the proper SELinux context:
sudo semanage fcontext -a -t var_lib_t "/var/lib/prometheus(/.*)?"
sudo restorecon -Rv /var/lib/prometheus
The first command tells SELinux which context the directory should use, and the second applies that context to the directory and all its contents.
If Prometheus still fails to start and the logs contain messages such as Opening storage failed, but the file permissions look correct, check for recent SELinux denials:
sudo ausearch -m avc -ts recent
If the output shows access denied messages for the Prometheus data directory, SELinux is blocking access. Fix the SELinux context before assuming there’s a problem with the disk or the TSDB itself.
Common Errors and What They Mean
found (hash collision on unrelated labels) During Compaction: This message appears when two different label sets produce the same hash value. Although it’s uncommon, Prometheus handles this automatically during compaction, and it usually isn’t a problem.
There’s nothing you need to fix unless the message is accompanied by other storage errors.
Disk Fills Up Even with retention.size Set: The --storage.tsdb.retention.size option limits the size of stored TSDB blocks, but it doesn’t include the Write-Ahead Log (WAL) or data that is still waiting to be compacted.
During periods of heavy metric collection, the WAL can grow to several gigabytes before its contents are written into blocks. For this reason, don’t set retention.size equal to the full capacity of your disk. Leave at least 10–15% free space so Prometheus has enough room for WAL growth and block compaction.
context deadline exceeded When Creating a Snapshot: If your TSDB is large or stored on slower disks, creating a snapshot may take longer than your client expects. Instead of assuming the snapshot failed, increase the timeout for the curl request:
curl --max-time 120 -X POST \
http://localhost:9090/api/v1/admin/tsdb/snapshot
In many cases, the snapshot continues running on the server even if the client times out, so check the snapshots directory before trying again.
Want to test Prometheus without risking your production server? Set up a small cloud VPS and experiment with retention policies, snapshots, and restores in a safe environment before applying them to live systems.
We recommend DigitalOcean, which offers cloud VPS plans starting at $4/month. TecMint Pro readers can also get up to $200 in free credits to launch their first server and follow along with this guide. We may earn a commission at no extra cost to you if you sign up through our affiliate link.
If tracking down Prometheus storage issues keeps coming up, share this chapter with your team so everyone knows where the data goes and how to manage it.
Conclusion
You now know how Prometheus stores metrics in its local TSDB, where the data is kept on disk, and how retention settings control when old data is removed.
You also learned how compaction reclaims disk space, how to inspect the TSDB with promtool, and how to create and restore snapshots using the built-in Admin API. These features are built into Prometheus, so you don’t need any additional tools to manage or back up your metrics database.
As a quick check, find out how your Prometheus server is currently configured:
ps aux | grep prometheus
Look for the --storage.tsdb.retention.time and --storage.tsdb.retention.size options. If neither is set, Prometheus uses its default retention behavior, which may eventually fill your disk depending on how many metrics you’re collecting.
If this article helped, with someone on your team.
