


SQL Server network latency is the delay each request spends traveling between your application and the database. It slows down more applications than people expect. I’ve watched four people spend three weeks tuning indexes when the real problem was thirty-two milliseconds of ping.
Network delay is rarely the first thing anyone checks. Before I look at a single query, I run one simple test. It takes five minutes, and it tells me where to look first.
The First Question to Ask
An application is slow, and everyone agrees on that. Someone says the database is slow, because the database always gets blamed first. Then the team starts reading execution plans, the diagrams that show how SQL Server runs a query.
Before any of that, ask one question. How long does the same query take when you run it on the server itself?
Say it takes forty milliseconds on the server and nine seconds from the application. That gap is a clue, not a diagnosis. Compare the same statement, with the same parameter values and settings. Then measure the time inside SQL Server and the time in the client separately.
The Round Trip Math
A round trip is one request from the application to SQL Server, plus the answer coming back. Say one round trip takes two milliseconds. That’s a healthy number on a local network, and nobody would complain about it.
Now say the application loads a customer. Then it loops through that customer’s 4,000 orders and fetches each one with its own query. That’s 4,000 requests, one after another.
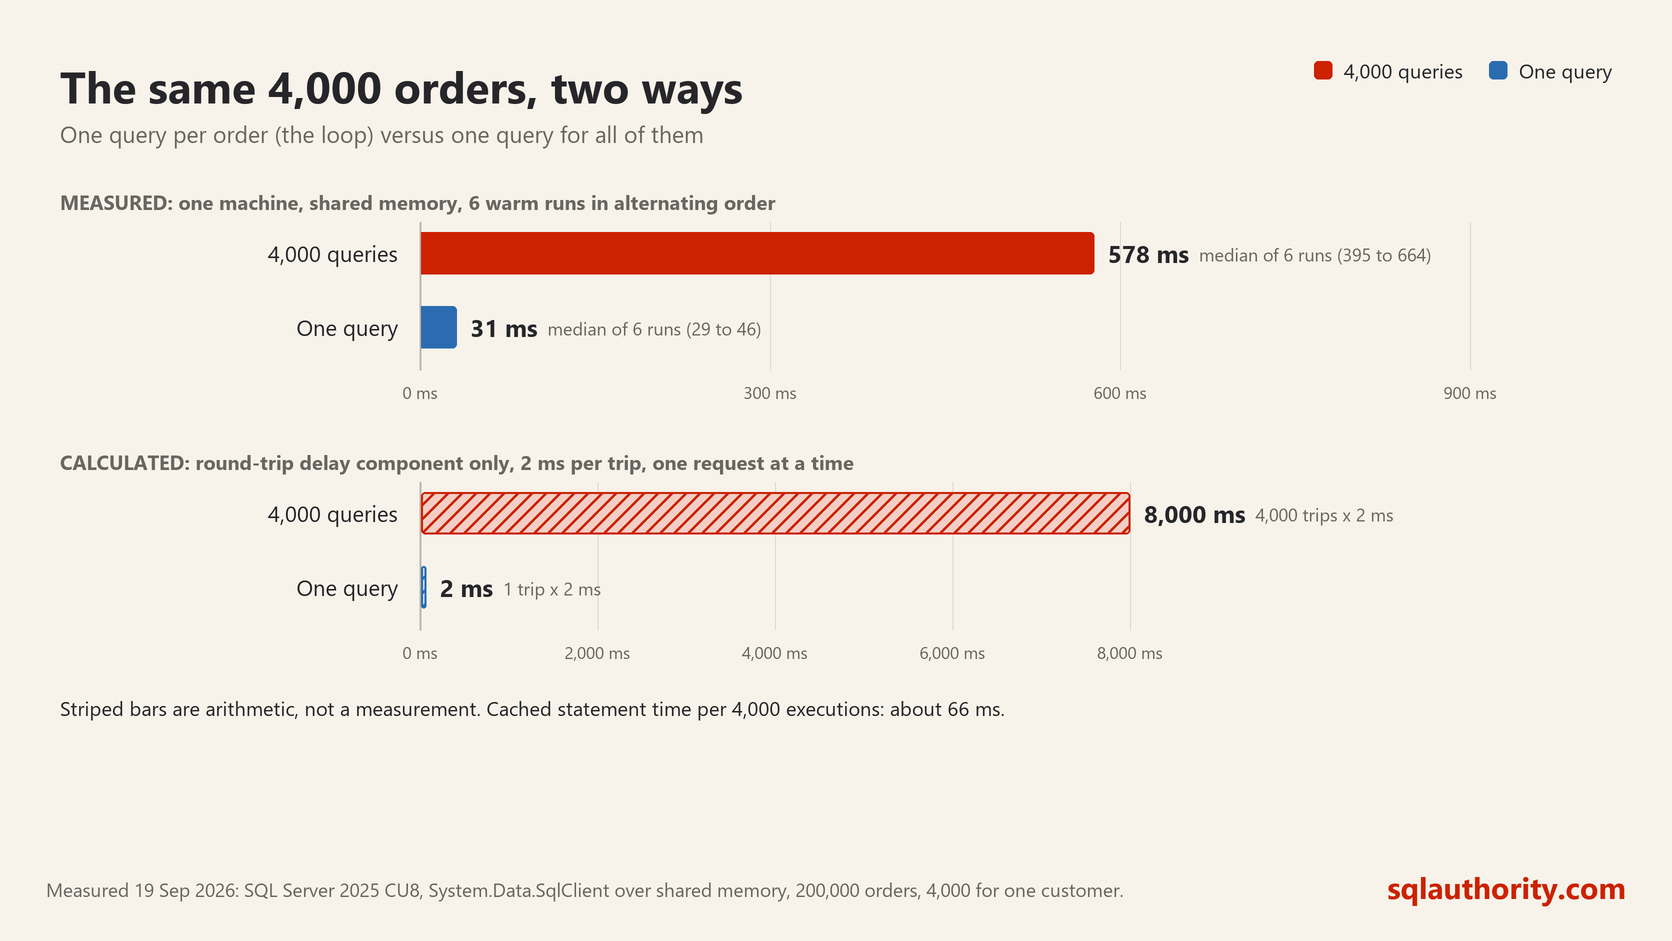
At two milliseconds each, the trips alone add eight seconds. That assumes the requests run one at a time, with no overlap. The database is busy for only a small part of that time. It’s like asking a waiter for one French fry at a time and then blaming the kitchen.
What I Measured
I tested this today on SQL Server 2025. I made a table of 200,000 orders, with 4,000 of them for one customer. The client ran on the same machine as SQL Server. The connection used shared memory, so there was no network path between separate machines.
I warmed up both methods first, then ran them six times in alternating order. Fetching the 4,000 orders one query at a time took 395 to 664 milliseconds. Fetching all 4,000 with one query took 29 to 46 milliseconds. That’s 12 to 23 times faster, without any network between machines.
SQL Server’s cached query statistics reported about 66 milliseconds of statement elapsed time per 4,000 executions. The rest of the client time includes request overhead, driver work and result handling. This test doesn’t separate those costs.
On a real network, each of those 4,000 requests also pays the network delay. The eight seconds above is my calculation for two milliseconds per trip, not a measurement.
How to Check Your Round Trip Time
The quick check is ping. Run it from the application server:
ping -n 20 yoursqlserverPing has two limits. Many firewalls block it, and it doesn’t include any of SQL Server’s own work. To time a small SQL request, run this in PowerShell on the application server. Use the same server name and connection settings as your application.
$cn = New-Object System.Data.SqlClient.SqlConnection "Server=yoursqlserver;Integrated Security=true"
$cn.Open()
$cmd = $cn.CreateCommand()
$cmd.CommandText = "SELECT 1"
for ($i = 0; $i -lt 20; $i++) { [void]$cmd.ExecuteScalar() }
$sw = [Diagnostics.Stopwatch]::StartNew()
for ($i = 0; $i -lt 200; $i++) { [void]$cmd.ExecuteScalar() }
$sw.Stop()
"Average SELECT 1 request time: {0:N2} ms" -f ($sw.Elapsed.TotalMilliseconds / 200)
$cn.Close()
It warms up, then sends 200 tiny queries on one open connection and prints the average. That’s request time, including SQL Server’s small share, not pure network delay. I ran it in Windows PowerShell 5.1 and PowerShell 7 on my test machine. It printed 0.19 and 0.35 milliseconds.
Match your application’s encryption setting too. System.Data.SqlClient defaults Encrypt to false. Microsoft.Data.SqlClient changed that default to true in version 4.0. Add Encrypt=true to the connection string if your application encrypts.
Here’s a rough guide from my own work. Under one millisecond points to the same data center. Twenty to sixty milliseconds points to traffic crossing a region or a VPN. Timing alone can’t prove where the traffic goes, so confirm the route with your network team.
For sequential requests, ping time multiplied by request count gives a rough estimate of network delay. Ping doesn’t measure SQL traffic directly. Multiplying the SELECT 1 time includes driver and server overhead too.
Latency Matters More Than Bandwidth
People like to quote bandwidth, but for this problem it’s seldom the issue. Bandwidth is how much data can move each second, like the width of a road. Latency is the delay on every single trip, like a traffic light.
Take an application that sends many small requests, one after another. Give it a one gigabit link with forty milliseconds of latency. It will run slower than on a hundred megabit link with one millisecond. For large file transfers, bandwidth matters more.
What ASYNC_NETWORK_IO Means
ASYNC_NETWORK_IO is a wait type that people misread. It doesn’t mean the network is broken. It means SQL Server has results ready, and the client hasn’t finished taking them yet.

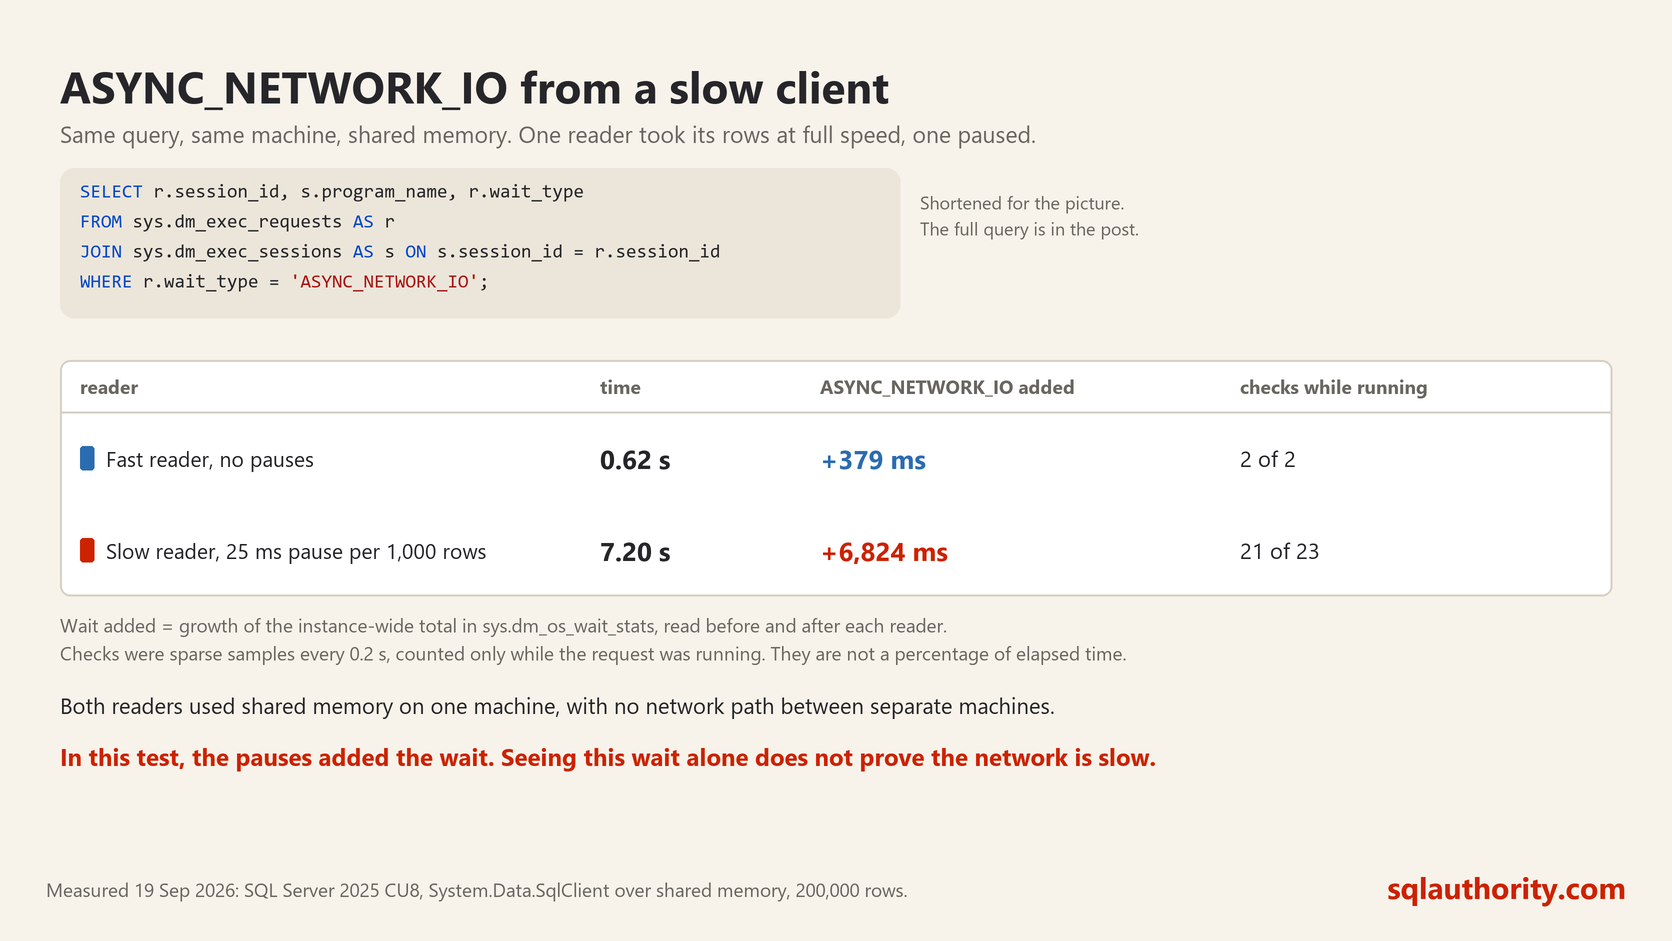
I tested this too. A client asked for 200,000 rows and paused a little after every 1,000 rows. It ran on the same machine as SQL Server, over shared memory. In 21 of the 23 checks while its request was running, it was waiting on ASYNC_NETWORK_IO.
For comparison, the same query read at full speed took 0.62 seconds. The wait showed up in both checks while its request was running. Every client needs some time to take its rows, so seeing this wait alone doesn’t establish a performance problem. In this test, adding pauses increased the recorded wait time.
So this wait doesn’t prove the network is slow. In my test, the client was slow to take the rows. Microsoft lists other causes too: large results, a client short on memory or CPU, and network problems.
In my experience, the cause is one of three things, in this order. The application does work on each row while the results are still arriving. The application asks for much more data than it uses. Or the link is slow, which is the least common and the one everybody guesses first.
How to See It Right Now
This query shows the sessions waiting on ASYNC_NETWORK_IO at this moment. Run it on the server while the slow operation is running:
SELECT r.session_id, s.program_name, r.status, r.command, r.wait_type, r.wait_time AS wait_time_ms, r.last_wait_type
FROM sys.dm_exec_requests AS r
JOIN sys.dm_exec_sessions AS s ON s.session_id = r.session_id
WHERE r.wait_type="ASYNC_NETWORK_IO";
The program_name column shows the application name reported by the connection. Use it to find the client to investigate. An empty result doesn’t rule the wait out. Repeat the check while the operation runs.
You’ll also see people check sys.dm_os_wait_stats for this. That view totals completed waits since SQL Server started, or since someone cleared the statistics. It covers the whole instance, not one session. So take one reading, wait a minute, and take another:
SELECT wait_type, waiting_tasks_count, wait_time_ms
FROM sys.dm_os_wait_stats
WHERE wait_type="ASYNC_NETWORK_IO";
In my test, the total grew by 6,824 milliseconds while the slow client ran. It grew by 379 milliseconds during the fast control. Both queries need VIEW SERVER PERFORMANCE STATE on SQL Server 2022 and later, or VIEW SERVER STATE on earlier versions.
What to Change
Stop the loop. Use one query that returns 4,000 rows, not 4,000 queries that return one row each. Many of these loops come from an ORM, a library that turns application code into database queries. The fix is to tell it to load the related rows in the same trip.
Ask for less. SELECT * sends every column, even the ones the application never shows. Ten unused columns on 200,000 rows is real extra data for the client to receive. If the client keeps the result in memory, those columns also use memory.
Move the work to the data. Say the application pulls a million rows only to add them up. Let SQL Server add them up and send back one number. In my experience, this is the biggest win in most of these cases.
Move the application closer. Sometimes the application ends up in one region and the database in another, after a migration. No query tuning will fix that delay. Every round trip pays for the distance.
Why This Keeps Happening
We reach for database tools, and database tools measure the database. They help us measure query execution, but they don’t explain every part of the application’s response time. The extra time can come from the client, connection handling or the network, and those tools don’t look there.
So the next time someone says the database is slow, don’t open a query plan first. Ask them to run the same thing on the server, and write down both numbers.
If both runs are slow, check server execution time and waits before choosing what to tune. If they don’t match, the difference tells you where to investigate next. It doesn’t prove that either the database or the network is at fault.
If your application is slow and you can’t find where the time goes, this is the kind of problem I work on with teams. You can see how a consulting engagement works on my consulting page.
A slow application is not proof of a slow database, it is proof that time is going somewhere.
Published by Pinal Dave on SQLAuthority. More of my work at pinaldave.com.
Discover more from SQL Authority with Pinal Dave
Subscribe to get the latest posts sent to your email.
