

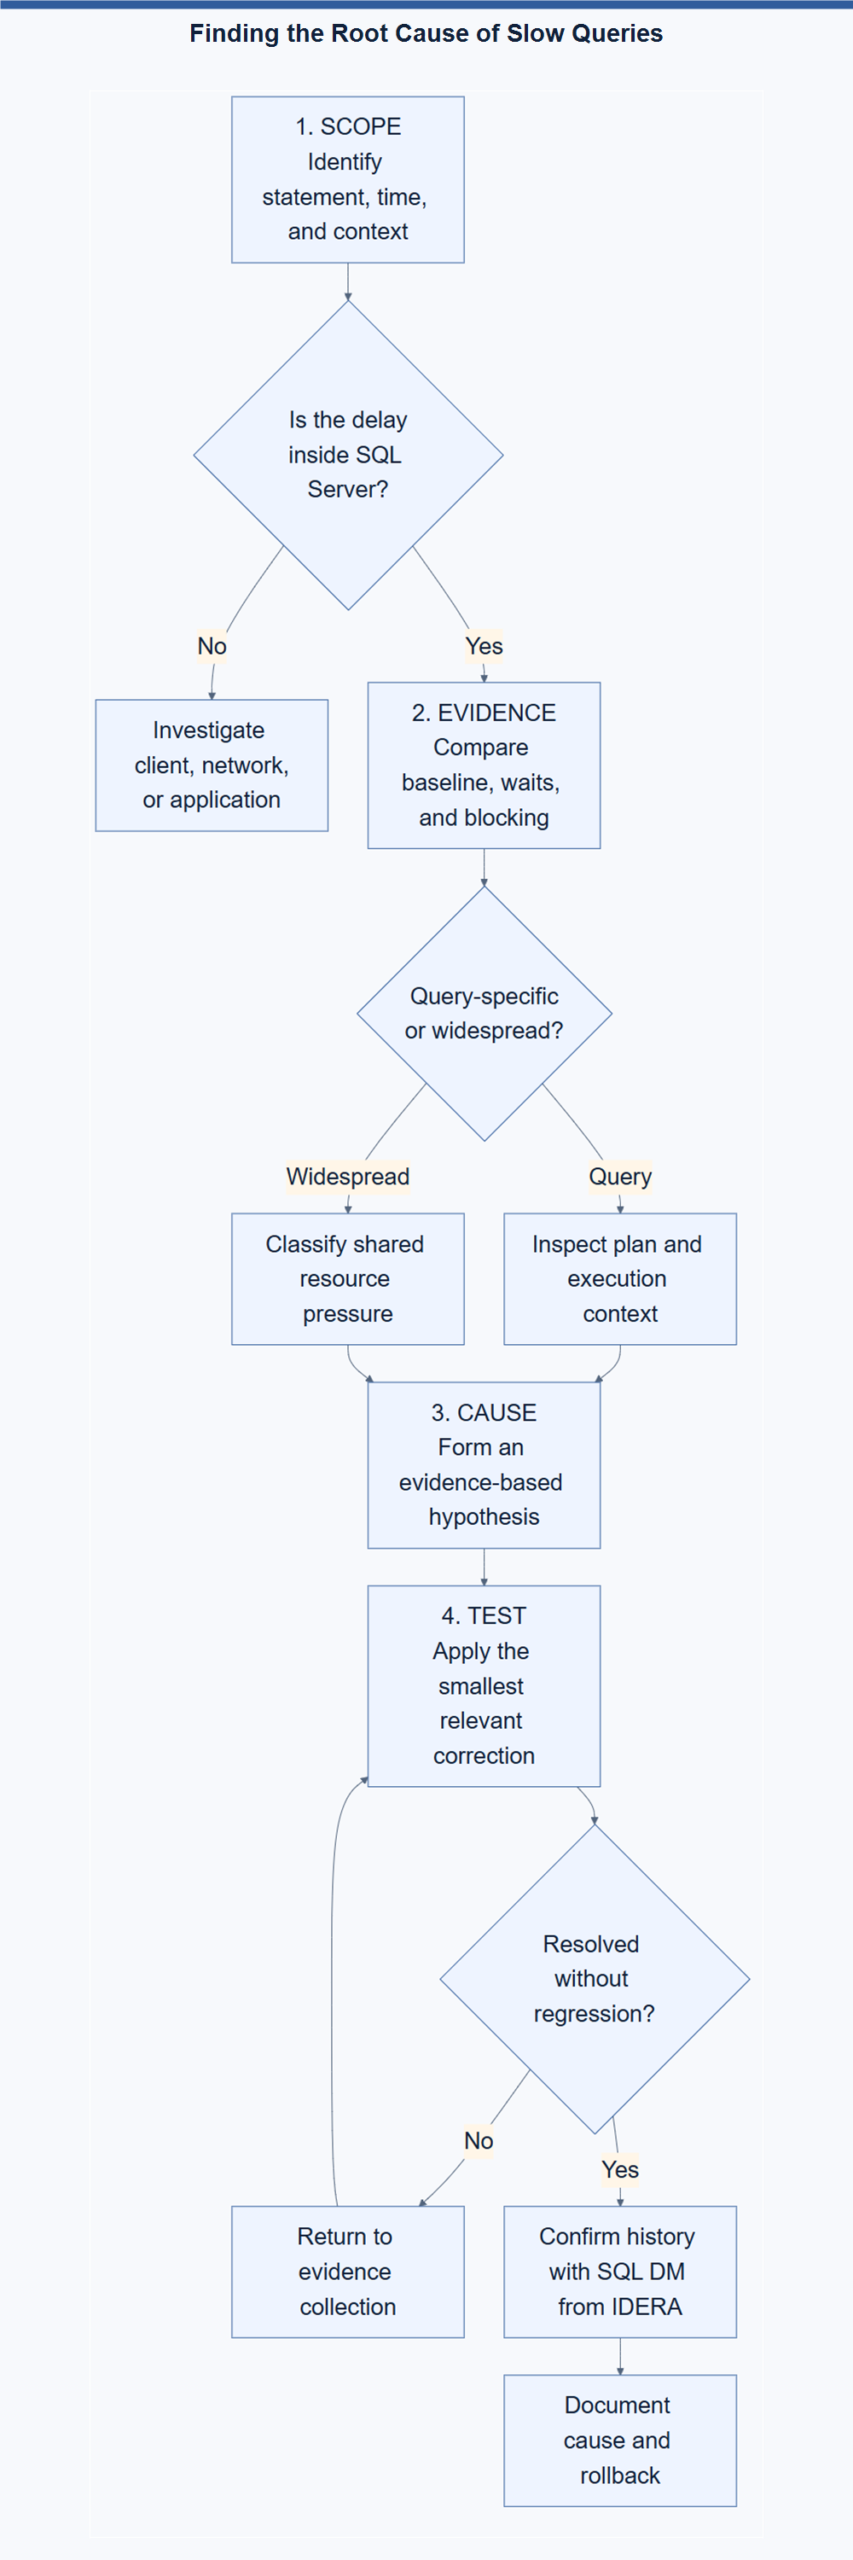
Finding the root cause of slow queries starts by separating work from waits, then testing theories against plans and history.
Finding the root cause of slow queries begins with an illustrative Tuesday morning. At 10:12, an order lookup that normally returned in 180 milliseconds took 14.8 seconds. Forty-three sessions piled up within five minutes, and the application team wanted a new index before lunch.
CPU stayed modest, logical reads remained familiar, and the cached plan matched yesterday’s fast plan. The request spent almost its whole life on an LCK_M_S wait. A nightly inventory process had left an update transaction open. The visible query was the victim, not the offender.
The team followed blocking_session_id until the chain ended at a sleeping session. Its last batch showed the inventory update, and transaction data confirmed the uncommitted work. Once that owner committed safely, latency fell below 200 milliseconds. Nobody edited the victim’s code, indexes, or statistics.
Slow Is a Symptom
Elapsed time tells you that users waited, not what consumed the time. A request can execute expensive work, wait for a resource, or alternate between both. Tuning begins only after you know which state dominates.
This distinction prevents attractive mistakes. Adding an index cannot release a lock held by another transaction. Updating statistics cannot repair storage latency. More CPU cannot help a request waiting for memory, a client, or a network response.
Make the First Split
A practical troubleshooting method separates running from waiting. Compare elapsed time with worker time for the request. Similar values usually indicate active processing, while a large gap means substantial waiting.
That first split does not solve the incident. It eliminates classes of wrong fixes before they reach the production server.
Parallel plans require care because total worker time can exceed wall-clock duration. The principle still holds: determine whether schedulers are working or a resource is unavailable. Then inspect the current wait type, wait duration, and wait resource.
| Observed signal | Frequent misreading | Better next check |
|---|---|---|
| Long duration, modest CPU | The query needs an index | Wait type, wait resource, blocking chain |
| High CPU, few waits | The server is undersized | Plan shape, estimates, rows processed |
| Spikes at fixed times | Somebody changed the code | Scheduled jobs, file latency, memory grants |
Lock waits require the complete blocking chain, not merely the blocked session. The head blocker often looks harmless because it sleeps between crimes.
Identify the Exact Statement
Start with the statement that users experience, not a similar batch copied from documentation. Capture its database, application, login, parameters, query hash, plan hash, and execution context. Those details separate one expensive pattern from thousands of harmless executions.
Query text alone can mislead. Different literals may trigger different cardinality estimates and plans. Session settings can also change plan selection. A normalized query signature groups related statements, while individual executions expose parameter-sensitive behavior.
Read the Actual Plan as Evidence
An estimated plan describes what the optimizer expected. An actual execution plan adds row counts and warnings. Compare estimated rows with actual rows at each operator. Large differences can expose stale statistics, skewed data, or parameter sensitivity.
Look for spills, excessive lookup repetitions, oversized memory grants, and unexpected scans. A scan is not automatically wrong, and a seek is not automatically efficient. Context decides whether an operator is expensive. The percentage printed on a plan is an estimate, not measured elapsed time.
Do not rerun a costly production statement to obtain an actual plan. Use a captured plan when possible, or reproduce the workload safely elsewhere. Evidence collection should not create a second incident.
Correlate Current Behavior with History
A snapshot explains one moment. History shows whether that moment is normal. Query Store preserves plans and aggregated duration, CPU, reads, and execution statistics under capture and retention. On SQL Server 2017 or later, enabled wait-statistics capture adds query-level waits.
The comparison window matters. Peak checkout traffic should not be compared with an overnight maintenance window. Match business cycles, data volume, execution frequency, and parameter mix. A lower average duration means little when easy executions dominate the sample.
SQL DM from IDERA can group queries by signature and collect performance details when Query Monitor is enabled. That history can connect a user complaint with the statement and resource pattern present then. Recorded evidence matters most after a transient problem disappears.
Follow the Server Context
The plan may be healthy while the environment is not. Check concurrent workload, blocking, memory grants, file latency, tempdb pressure, and recent configuration changes. A query can become slow because another process consumed the resource it normally receives.
Correlate timelines before assigning blame. A storage latency spike at 10:11 may explain several unrelated slow statements at 10:12. Shared pressure leaves evidence across many sessions.
When Focused Query Tuning Is Enough
Sometimes the query itself is inefficient, and broader investigation delays an obvious repair. Consistently high CPU, excessive reads, stable waits, and repeatable plan behavior can justify focused tuning. That case deserves prompt action.
Even then, test the proposed change against representative parameters and neighboring statements. An index can accelerate one lookup while increasing write cost elsewhere. A hint can stabilize today’s plan while hiding tomorrow’s data change. Fast local results do not guarantee healthy workload results.
Turn Evidence into a Decision
SQL DM from IDERA brings live metrics, query details, alerts, and historical context into one investigation path. The value is keeping enough context to test competing explanations quickly and safely.
Good diagnosis ends with a claim somebody could prove wrong. Name the resource, query, plan change, or transaction responsible. Record the supporting metrics and the expected result of the fix. Then measure again under comparable conditions.
The next time a query looks slow, pause before changing it. Ask whether it worked, waited, or changed since yesterday. The answer usually costs ten minutes and saves a wasted index.
A slow query is a symptom, while the root cause is the work, wait, or change behind it.
Reference: Pinal Dave (https://blog.sqlauthority.com/), X
