


Every check is green. Every validation rule passed. The pipeline reports success in cheerful little checkmarks. And the dashboard is still, somehow, wrong. That gap is exactly what data pipeline monitoring exists to close, and most teams do not have it.
This confused me for an entire afternoon once. Every rule I had written was passing, because every rule asked about the contents of a row, and every row was fine. What none of them could tell me was that yesterday’s file had never arrived. The table was full of perfectly valid data that was exactly one day stale.
My checks were guarding the rooms while someone walked off with the building.
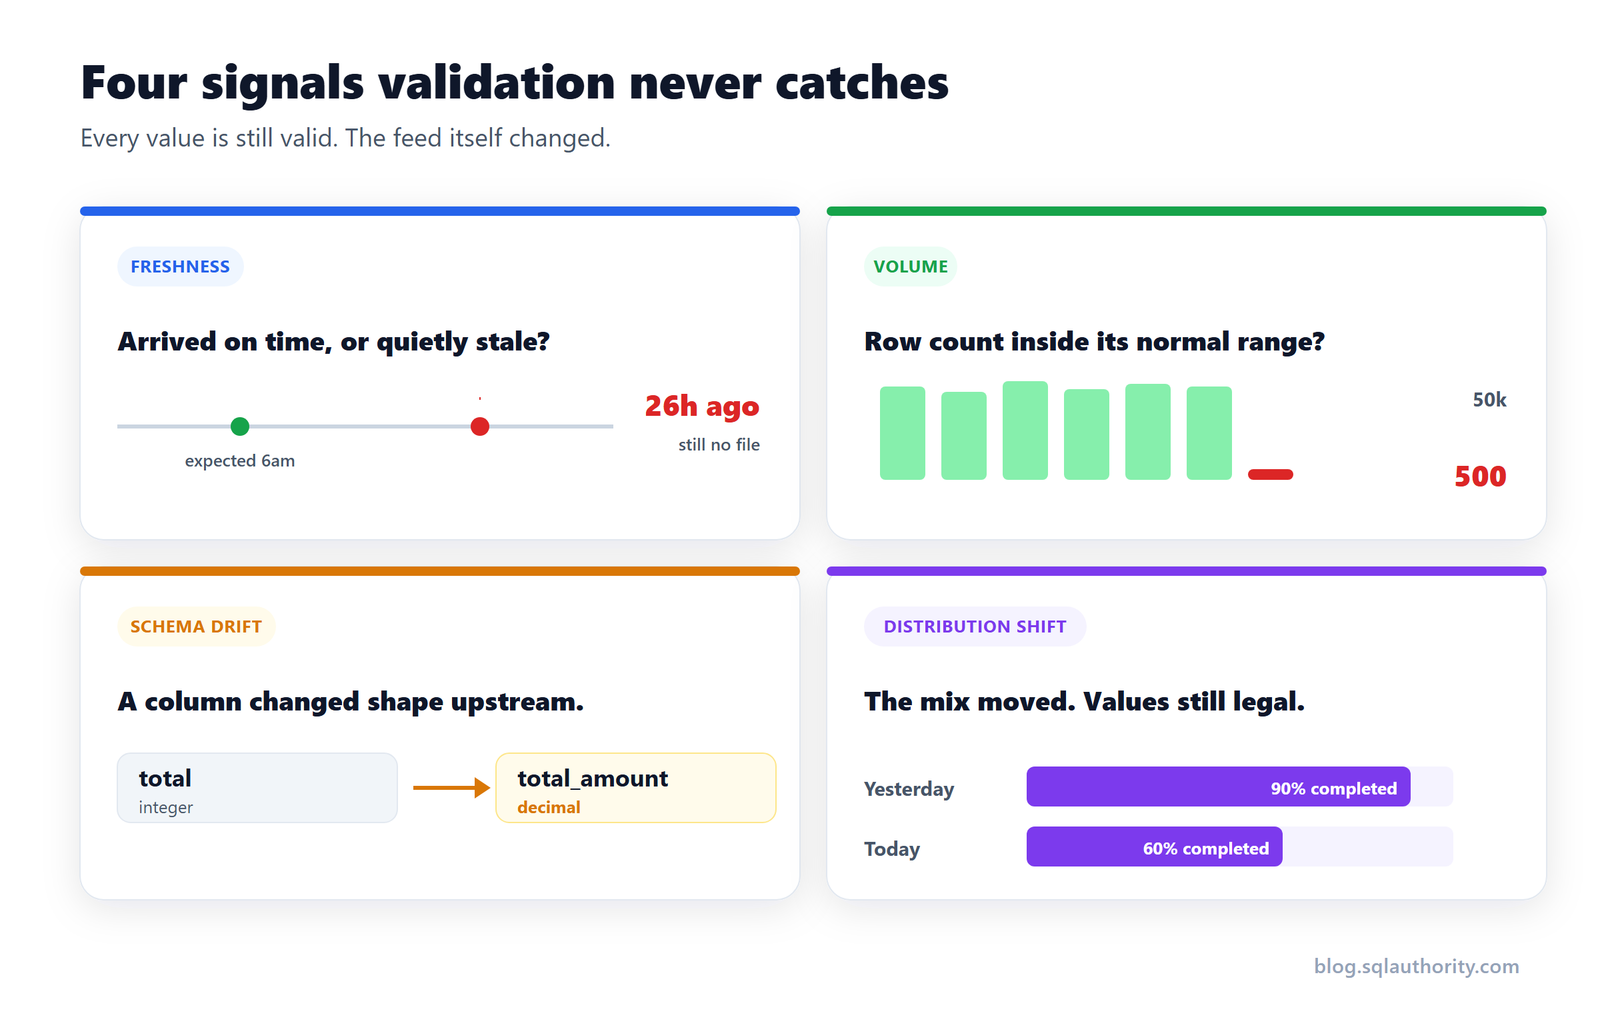
Validation asks “is this row ok.” Observability asks “did the feed change.”
Validation takes a record and checks it against a rule you wrote in advance. Is the region present? Is the amount positive? Is the id unique? Good questions, and they catch plenty. But notice what they share. You had to know to ask them. Validation only catches the failures you already imagined.
Observability watches the behavior of the whole feed over time and asks something different. Is this feed acting the way it usually does? That question catches the failures nobody thought to write a rule for, and those are the ones that hurt.
The four signals that watch behavior, not rows
None of these can be caught by staring at a single row.
Signal one: freshness
Did the data arrive on time, or is a valid-looking table quietly stale? This is the one that got me. Every value can be correct and the table can still be wrong, because it is yesterday’s correct. Freshness watches the clock, not the contents.
-- Freshness as a check. How stale is the newest row?
SELECT MAX(loaded_at) AS last_load,
       DATEDIFF(hour, MAX(loaded_at), GETDATE()) AS hours_stale
FROM sales_orders;
Not one value is inspected there. The query only asks when the table last moved. Alert when hours_stale crosses the window you expect, and you have caught the failure that ate my afternoon. A row-level rule never would, because the rows sitting there look great.
Signal two: volume
Feeds have a rhythm. A daily load that usually brings in fifty thousand rows and today brings five hundred is screaming that something upstream broke, probably a partial load. A load that suddenly brings five million is screaming just as loudly in the other direction, maybe a duplicated source or a runaway join. Every individual row can be flawless. The count is the tell.
Signal three: schema drift
Upstream systems change without asking your permission. A column that held a whole number starts holding a decimal. A field named total becomes total_amount. A column vanishes entirely, and your pipeline, being agreeable, fills it with nulls and carries on. Schema drift catches that on the day it happens, instead of three weeks later when someone asks why a chart went flat.
Signal four: distribution shift
The subtle one, and my favorite, because it is so sneaky. Every value is still legal, but the mix has moved. Yesterday, ninety percent of your orders were in the “completed” status. Today, sixty percent are. No rule was broken. Both values are perfectly valid. But the shape of reality shifted, and it usually means something real happened upstream, like a status field that stopped updating.
You cannot spot abnormal without defining normal
All four signals need the same thing. To know that today is weird, you have to know what a normal day looks like. That is a baseline: the usual arrival time, the usual row count, the usual schema, the usual mix of values.
The good news is that normal is mostly just history. Your feed has been telling you what it usually does for months. You only have to start listening and write it down.
A quick word on not drowning in alerts
Set up monitoring for the first time and the temptation is to alert on everything. Within a week half the alerts are noise and all of them are muted.
Alert on the size of the change, not the fact of it. A row count that drops two percent is Tuesday. A row count that drops sixty percent is an incident. Tune the thresholds so an alert means “come look now,” not “a number moved slightly, as numbers do.”
Start your data pipeline monitoring this week
Pick your most important table and answer four questions you have probably never written down. When should it arrive? How many rows is normal? What is its schema supposed to be? What is the usual mix of values in the column you care about most?
Write the answers somewhere. You just built a baseline, which is most of observability.
Rules protect you from the mistakes you imagined. Monitoring protects you from the ones you did not. And the feeds that take down a dashboard are almost always in that second group, sitting there green and confident and quietly wrong.
If you want to see these monitors built with real data, I walk through freshness, volume, schema, and distribution in my Pluralsight course, Monitor Data Health with Data Observability.
Reference: Pinal Dave (https://blog.sqlauthority.com/), X
