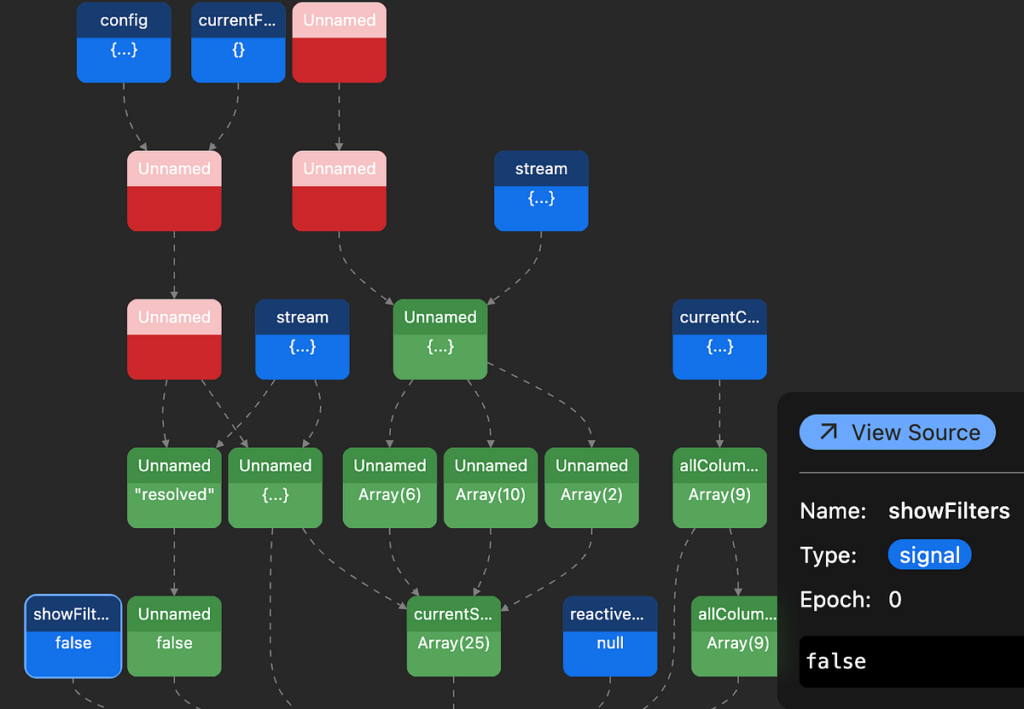
Angular 20.1 introduced a new experimental feature that displays a dynamic Signal graph of all Signal dependencies for a given component.
In this brief tutorial, we’ll explore how to access the graph and what type of information it displays.
Your application needs to be upgraded to Angular 20.1 or later and use the latest version of Chrome or Firefox.
With your Angular application running in development mode, open Chrome DevTools (F12 or Cmd+Option+Ior right-click then “Inspect”).
Inside the DevTools, open the “Angular” tab (install it from the Chrome Web Store or from Firefox Addons if you don’t have it yet).
With the Angular DevTools are open, click on the settings icon and enable the Signal Graph option:
Once the Signal Graph is enabled, use the component selection tool to select a component that uses Signals.
The right panel of the DevTools will show you all component properties, injected services, as well as a brand new “Show Signal Graph” button:
When you click on that button, the Signal Graph shows up as a tree with all dependent Signals displayed:
We can see that the Signal Graph is using different colors. Blue is for regular signals, green is for computed signals, red is for linked signals.
Of course, several Signals are “system” signals from the Angular framework. For instance, in the above graph, we can see “stream” signals that derive a computed “resolved” value: Those are Angular HTTP resource signals.
When you click on a Signal, you can see its current value, its “name” (which is the name of the variable you assigned the signal to — this explains why effects and computed signals show as “unnamed” in the graph) the type of the signal, as well as the “epoch”, which is the number of times this signal has changed since loading the application:
Interacting with the UI displays live updates in the graph, and impacted signals blink as their values change. This is useful to check if your Signal hierarchy is working as expected, especially when using complex computed values. No breakpoint needed!
While the Signal Graph is an experimental feature, it is already in a promising and valuable state. We can expect additional features in the near future, such as the ability to hide “system” signals. In any case, feel free to explore your Signal Graphs and let me know if you get valuable insights from them!
My name is Alain Chautard. I am a Google Developer Expert in Angular, Microsoft MVP, and a consultant and trainer at Angular Training, where I help web development teams learn and become proficient with Angular / React / JavaScript.
If you need any help learning web technologies, feel free to get in touch!
If you enjoyed this article, please clap for it or share it. Your help is always appreciated. You can also subscribe to my articles and Weekly Angular Newsletter to receive helpful weekly tips and updates about Angular.

